
An Analysis of General Motors (GM) Stock Based on Elliott Wave Theory
This review examines GM stock movements through Elliott Wave structures including impulse waves, corrections, and Fibonacci retracements.
Review Article
This is the General Motors study from our Elliott Wave research series. The series applies the same wave framework to four very different markets; the companion studies are published as standalone articles:
- Ethereum Analysis Based on the Elliott Wave Principle
- Analysis of IBM Stock Price Movements Using the Elliott Wave Principle
- 1987 Black Monday: A Market Crash Through the Elliott Wave Principle
Key Takeaways
- GM's chart shows a completed five-wave advance followed by a three-wave correction.
- The correction appears complete, pointing to a developing higher-degree third wave in the stock.
- The wave structure aligns with Fibonacci ratios, consistent with the other case studies in this series.
The Featured Case: General Motors Stock
An Analysis of General Motors (GM) Stock Based on Elliott Wave Theory
Review Article
An Analysis of General Motors (GM) Stock Based on Elliott Wave Theory


1) Psychological Dynamics Behind Wave Movements
Financial market movements cannot be explained solely by economic data. The market is a reflection of collective investor psychology, which manifests itself in waves (Elliott, 1938). The Elliott Wave-based chart of General Motors (GM) stock also exhibits traces of this wave structure. This chart is not merely a product of technical analysis but also a tangible representation of investor sentiment.
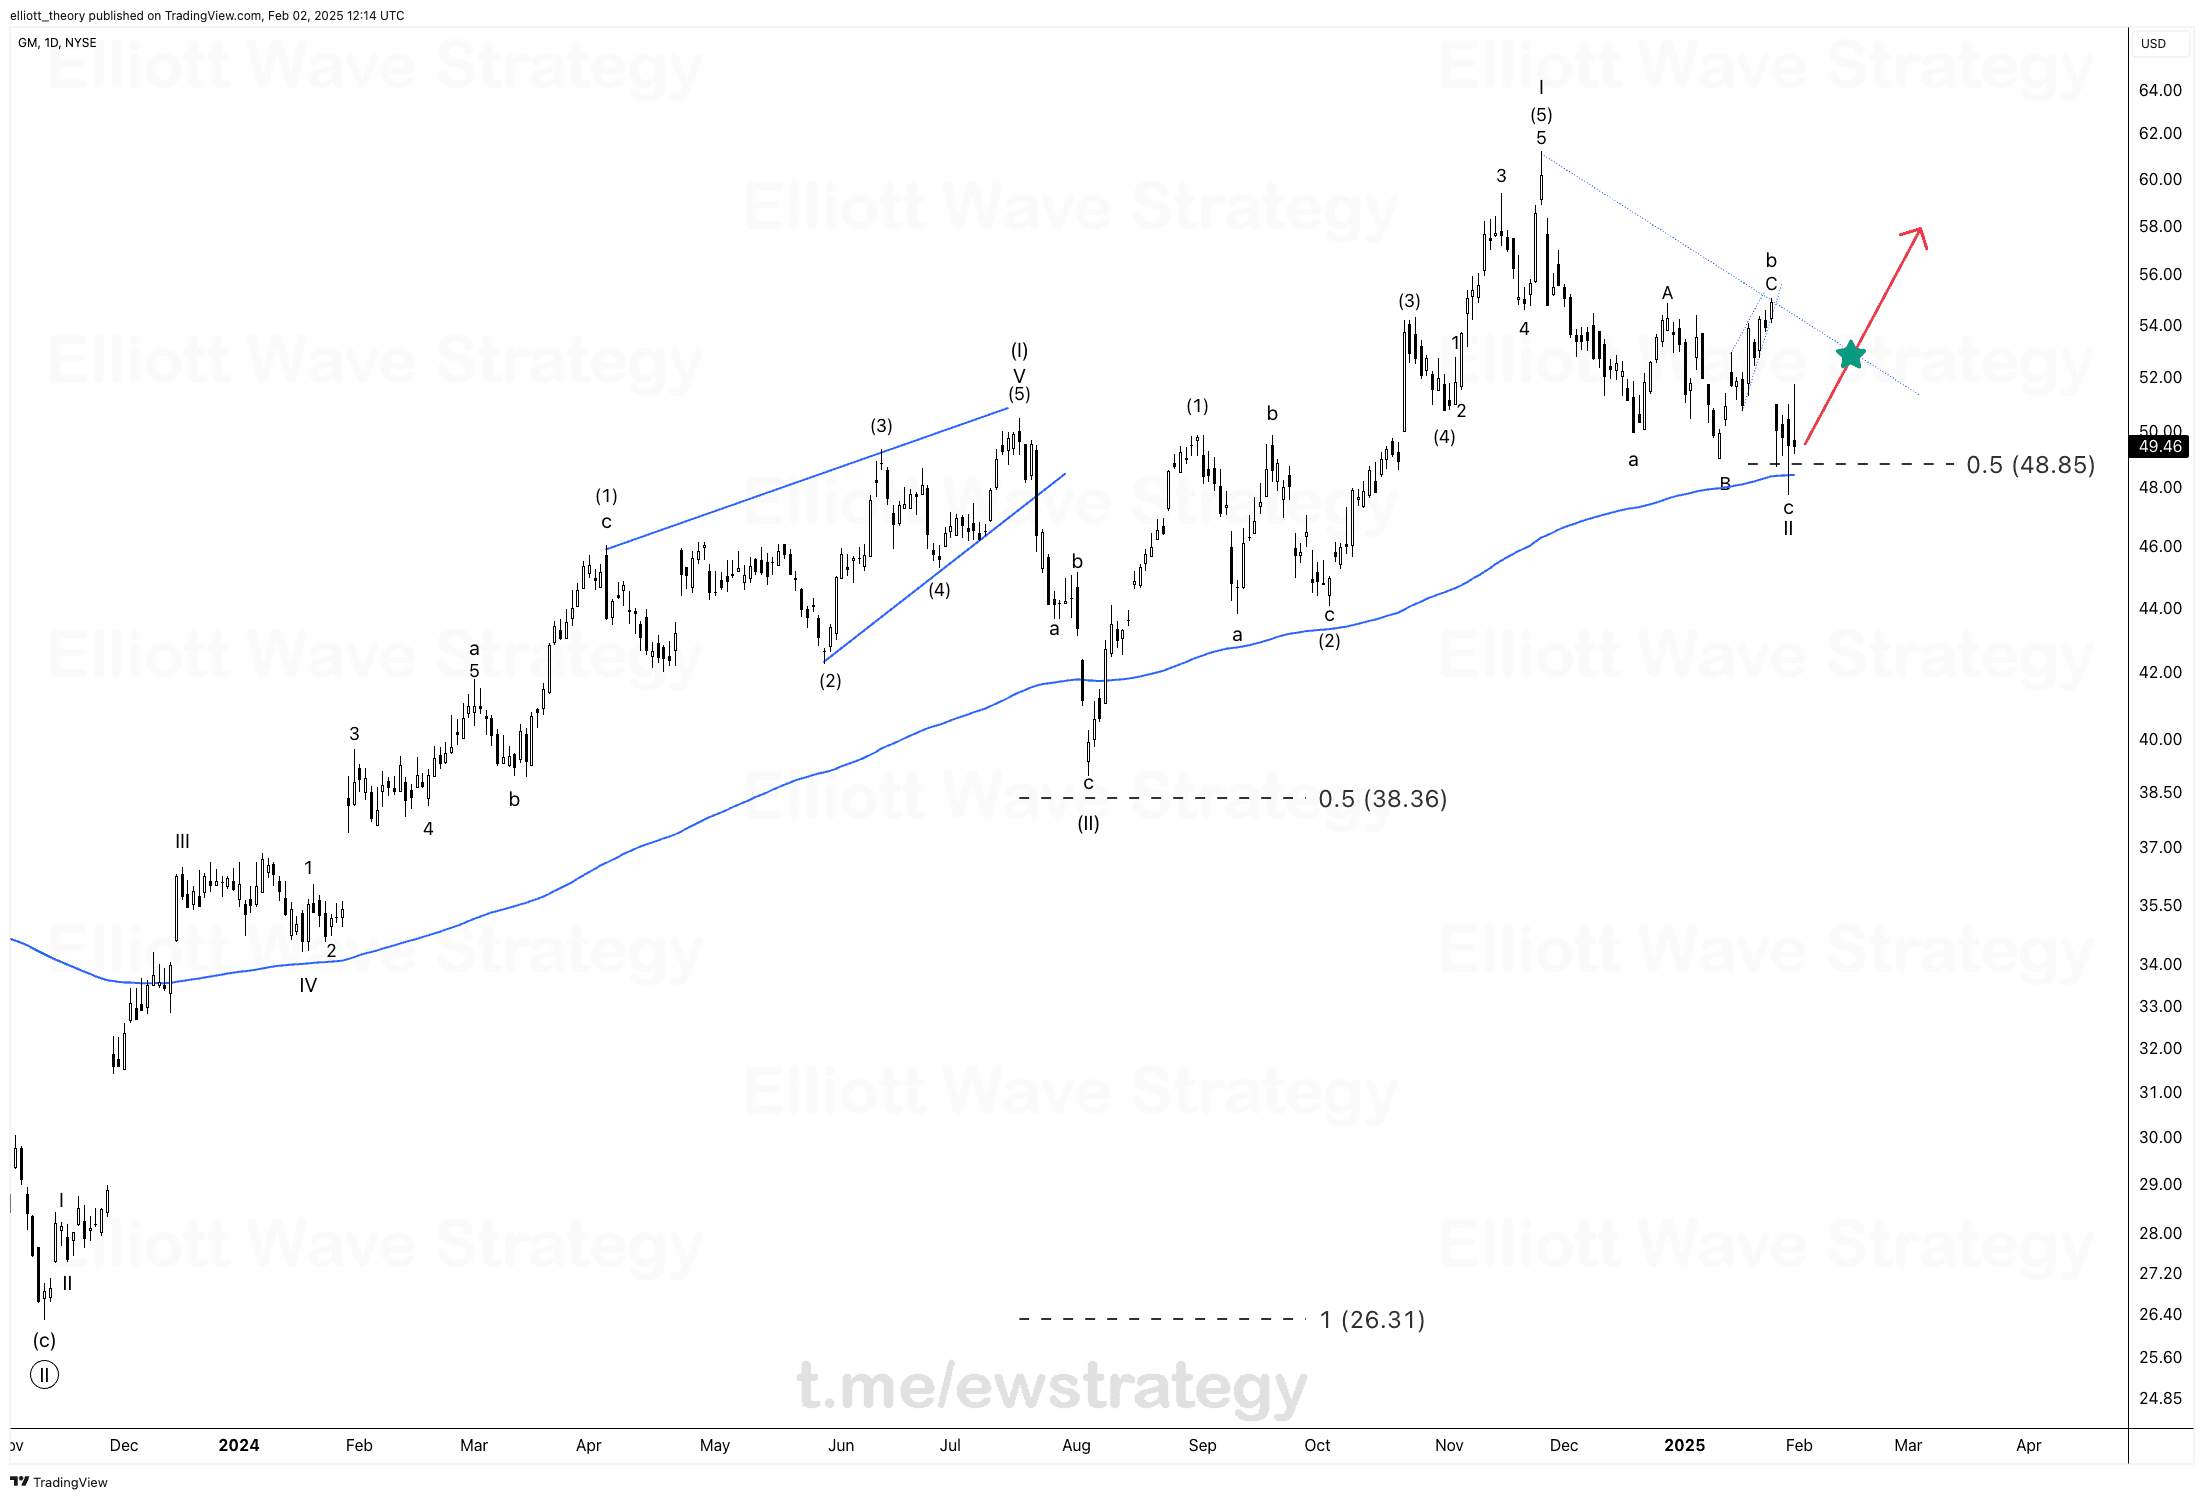
According to Elliott Wave Theory, market movements follow a specific cycle consisting of a five-wave impulsive move and a three-wave corrective move (Elliott, 1938). Examining GM’s current price movements reveals that prices have been progressing in a distinct five-wave structure. These waves provide crucial insights into how investor sentiment evolves over time and how the market reacts to these shifts.
2) The Third Wave: A Sign of Strong Momentum
In Elliott Wave Theory, the third wave is typically the phase where the strongest momentum is observed and investor interest reaches its peak (Gorman & Kennedy, 2013). GM’s chart also demonstrates that the third wave has exhibited a significantly larger upward movement compared to other waves. Additionally, one can observe the presence of gap formations in every third wave. This indicates that the market is progressively entering a more optimistic sentiment phase, leading investors to take on greater risks.
From Speculative Peak to Correction in GM
3) The Fifth Wave and Speculative Surge
According to Elliott’s theory, the fifth wave is generally characterized by heightened investor optimism, yet technical indicators tend to weaken in this phase (Prechter, 2009). In GM stock’s recent movements, it is evident that while the price has resumed an upward trajectory, trading volume has been declining. This is often regarded as a "final surge," after which the market is expected to enter a corrective phase. Notably, on November 25, 2024, despite the price experiencing a final increase, momentum failed to support this rise. Our published GM count at that time flagged the momentum divergence into the final high and the corrective phase we expected to follow. Following November 25, 2024, we expected a three-wave corrective movement, which indeed materialized. The ABC zigzag correction reached the 200-day EMA moving average. With the break of the downtrend, we anticipate the stock price to initiate a new uptrend.


4) Fibonacci and Technical Confirmations
Elliott Wave Theory is reinforced by Fibonacci ratios, allowing for more precise predictions (Prechter & Frost, 2017). In GM’s analysis, the application of Fibonacci levels reveals that prices have established strong support zones around the 0.50 level. Additionally, it is observed that the price is currently finding support at the 200-day EMA moving average. All these factors indicate that waves move within a mathematical order and that market psychology aligns with these Fibonacci ratios.
Herd Psychology and the Outlook for GM Stock
5) The Role of Market Sentiment: Herd Psychology and Investor Decisions
Herd psychology plays a significant role in financial markets, contributing to the formation of wave patterns in price movements (Jiménez Méndez & Calvo Espinal, 2001). The wave analysis of GM stock suggests that investors tend to follow the general market direction, reinforcing trends under the influence of herd behavior. This confirms that price movements are not solely dependent on economic data but are also driven by the collective psychology of investors.
6) Conclusion: Predictability of Wave Movements and Investment Strategies
When analyzed through the lens of Elliott Wave Theory, GM stock demonstrates that investor psychology follows a structured pattern, manifesting in waves. Just as every rally in the market is followed by a correction, every decline is eventually met with a recovery. Elliott Wave Theory provides investors with the opportunity to determine the market phase and formulate strategies accordingly (Močan, 2019).
In conclusion, we believe that GM’s current price movements indicate the completion of the three-wave corrective phase following the five-wave impulsive move. Therefore, we anticipate that the stock price will rise to complete the higher-degree (III). Wave, supported by the 200-day EMA moving average. GM stock aligns with the Elliott Wave Principle, demonstrating a direct correlation with investor sentiment and market psychology. By analyzing Fibonacci ratios and wave structures, more informed projections of future price movements can be made. However, as with any technical analysis method, Elliott Wave Theory does not provide absolute certainty on its own; investors should incorporate this theory with other technical and fundamental analysis tools for more comprehensive decision-making.
References
Elliott, R. N. (1938). The wave principle. Robert R. Prechter Archive.
Jiménez Méndez, J., & Calvo Espinal, A. (2001). Elliott wave theory and market psychology. Financial Research Journal.
Prechter, R. R. (2009). Conquer the crash: You can survive and prosper in a deflationary depression. John Wiley & Sons.
Prechter, R. R., & Frost, A. J. (2017). Elliott wave principle: Key to market behavior. New Classics Library.
Močan, M. (2019). The effectiveness of Elliott wave theory in financial markets. Journal of Technical Analysis.
Gorman, D., & Kennedy, T. (2013). Applying Elliott wave theory to market forecasting. Financial Analysts Journal.
ContentEducational Use and Risk Disclaimer
DISCLAIMER
The information provided on www.ew-strategy.com is for educational and informational purposes only and solely as a self-help tool for your own use. It is the responsibility of the viewer to first consult with a trusted financial advisor, or other qualified financial professional before making any investment decisions.
While we strive to provide accurate, up-to-date information, we make no representations or warranties of any kind, express or implied, about the completeness, accuracy, reliability, suitability, or availability with respect to the website or the information, products, services, or related graphics contained on the website for any purpose. Any reliance you place on such information is strictly at your own risk.
The information provided on this website does not constitute investment advice, financial advice, trading advice, or any other sort of advice, and you should not treat any of the website's content as such. Artavest Oy does not recommend that any cryptocurrency, security, portfolio of securities, transaction, or investment strategy is suitable for any specific person.
Artavest Oy is not responsible for any loss caused by any information provided on the website. Investing and trading in financial markets or cryptocurrencies can be risky. You should conduct your own research when making any financial decisions.
The views expressed on this website are those of the authors based on their experience and expertise. The views expressed on this website are subject to change based on market and other conditions.
All information is provided "as is" without warranty of any kind. Artavest Oy and any respective partners, agents, or affiliates, are not liable for any informational errors, incompleteness, or delays, or for any actions taken in reliance on information contained herein.
By accessing this website, you agree to the above disclaimer and hold harmless Artavest Oy and any of its affiliates, partners, and contributors from any liability.
Frequently asked questions
What is Elliott Wave analysis?+
Elliott Wave analysis is a form of technical analysis based on the theory that financial markets move in predictable wave patterns reflecting crowd psychology. Markets advance in five-wave impulse patterns and correct in three-wave patterns.
How accurate is Elliott Wave analysis?+
Accuracy depends on the analyst's skill, the instrument, and how the result is measured. At EW Strategy, every published call carries a direction, target levels and an invalidation level stated in advance, and every outcome is recorded against them. We are rebuilding that record from the raw archive under a measurement rule published before any figure, and we would rather show nothing than a headline number we cannot defend.
Can Elliott Wave analysis be used for day trading?+
Yes. Elliott Wave patterns appear at all timeframes, from 1-minute charts to monthly charts. Day traders typically focus on sub-minuette and minuette degree waves for intraday setups.
Elliott Wave analyst with 15+ years of experience. Covers 27 instruments daily across Forex, Commodities, Indices and Crypto. Founder of Artavest Oy, Helsinki.