

What Gold's 1980 Peak Is Worth Today
Everyone quotes the old high and almost nobody names the deflator. Take a peak of 100 and four round growth factors: consumer prices give 400, money per ounce 640, nominal output 1,200, broad money
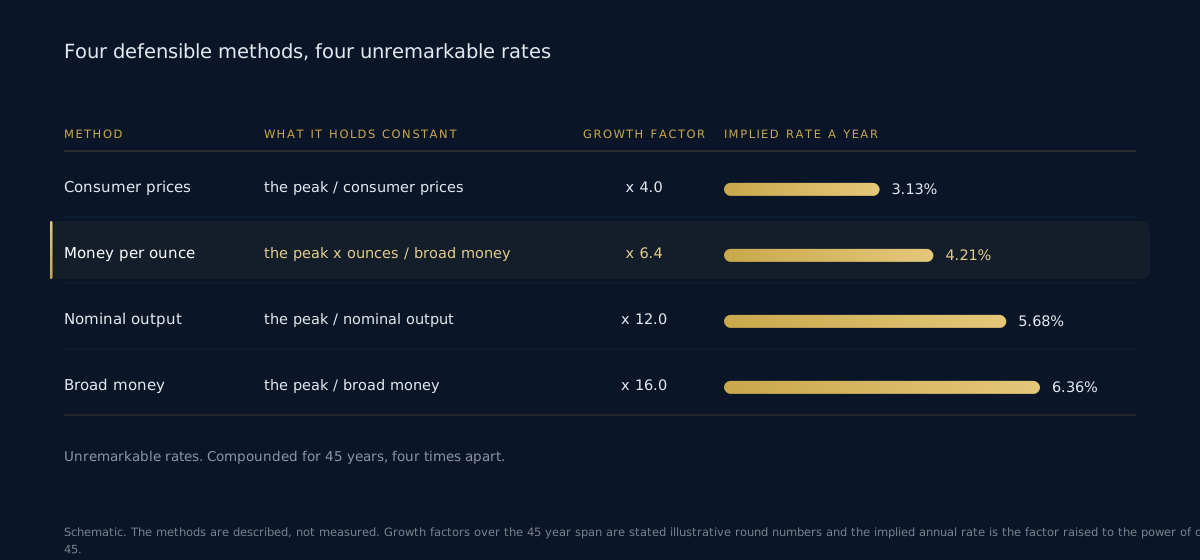
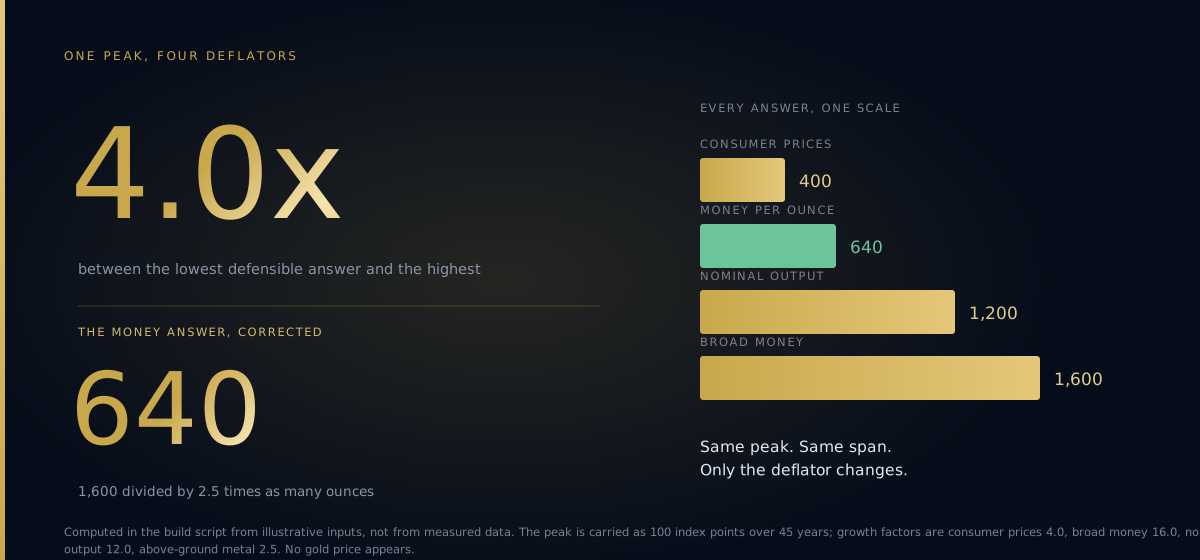
Quick answer: It depends entirely on the deflator, and the spread between defensible answers is wide enough to make any single quoted figure useless on its own. Carry the peak as 100 index points over a round 45 year span. Deflate by consumer prices that grew four-fold and the peak is 400. By broad money that grew sixteen-fold, 1,600. By nominal output that grew twelve-fold, 1,200. Correct the money version for an above-ground metal stock that grew 2.5 times and you get 640. Four defensible methods, a four-fold spread, and none of it caused by anything that happened to the metal.
The old high gets quoted constantly. It turns up in forum arguments, in newsletter subject lines and in the third paragraph of almost every long-horizon gold piece written in the last decade, and it is nearly always quoted raw. A nominal number from four decades ago, set against a nominal number from this morning, as though the two were the same unit.
They are not, and the correction is not a technicality. Adjust properly and the old high moves by a multiple. What almost nobody does is say which adjustment they used, and the choice of adjustment matters more to the answer than the peak does.
What deflating actually does
Deflating is not one calculation. It is a question, and the question is: what do you want held constant between then and now?
Answer "purchasing power" and you get one number. Answer "share of the money stock" and you get a different one. Answer "share of the economy" and you get a third. Each answer is arithmetically sound. Each holds something different constant, and each therefore quietly asserts something different about what gold is for.
That is why two careful analysts publish figures that differ by a multiple and neither of them has made a mistake.
The four candidates
Consumer prices. Holds purchasing power constant. The most common choice and the most conservative. Its weakness is that the basket has been rebased and re-specified many times, so two defensible vintages of the same national series give visibly different answers across 45 years.
Broad money. Holds the price as a constant fraction of the money stock. The version favoured by anyone who treats gold as a monetary asset rather than a commodity, and it produces the largest number by a wide margin. Its weakness is severe and I will come back to it.
Nominal output. Holds gold as a constant share of what the economy produces. Defensible if you read gold as a claim on real activity. Its weakness is that nominal output grows through real growth as well as inflation, so the method credits gold with productivity it played no part in.
Above-ground metal. Less a method than a correction the other three need. The number of ounces has grown. If the aggregate claim stays constant while the ounce count rises, the price per ounce has to fall.
The worked example
Round numbers throughout, chosen so the arithmetic can be done in your head and nothing hides behind a spreadsheet. The peak is 100 index points, deliberately not a price. The span is 45 years. The growth factors are illustrative.
| Method | Growth factor over 45 years | Implied rate a year | Arithmetic | Adjusted peak |
|---|---|---|---|---|
| Consumer prices | 4.0 | 3.13% | 100 x 4.0 | 400 |
| Money per ounce of metal | 6.4 | 4.21% | 100 x 16.0 / 2.5 | 640 |
| Nominal output | 12.0 | 5.68% | 100 x 12.0 | 1,200 |
| Broad money | 16.0 | 6.36% | 100 x 16.0 | 1,600 |
Look at the implied rate column before the level column. Every one of those annual rates is unremarkable. Nothing in the range from 3.13% to 6.36% a year would raise an eyebrow in isolation. Compound them for 45 years and they produce answers four times apart.
That is the entire story of long-horizon deflation. Small differences in the rate, enormous differences in the level, and the difference is invisible until you multiply it out.
Why the money argument is usually done wrong
You have read this version a hundred times. Broad money has grown enormously since 1980, gold has not kept up, so gold is cheap by a factor of several and the adjusted peak is enormous.
The arithmetic is fine. The framing is missing a side.
Deflating a price per ounce by growth in the money stock treats the ounce count as fixed, and it has not been fixed. Mines have run continuously for 45 years and almost every ounce ever produced still exists, because gold is not consumed the way copper is. If the metal stock grew 2.5 times, holding the aggregate claim constant means the per-ounce claim fell to 40% of what it was.
Run it properly. Money grew 16.0 times, the metal stock grew 2.5, so money per ounce grew 16.0 divided by 2.5, which is 6.4. The peak adjusts to 640 rather than 1,600.
The correction cuts the headline number by 60%, and it cuts in the same direction every time, because the metal stock only ever grows. Anyone quoting the raw money-adjusted figure is quoting a number they have not finished calculating.
Note the flip side, since it is the honest half. Deflating by the metal stock alone gives 100 divided by 2.5, which is 40. That is not a defensible answer either. It holds gold's aggregate value constant across 45 years in which the world's money and output both multiplied, and no reasonable person believes that. The metal stock is a correction to be applied inside another method, never a method on its own.
Half a point a year is worth a quarter of the answer
Now the sensitivity, because it explains why this argument never gets settled.
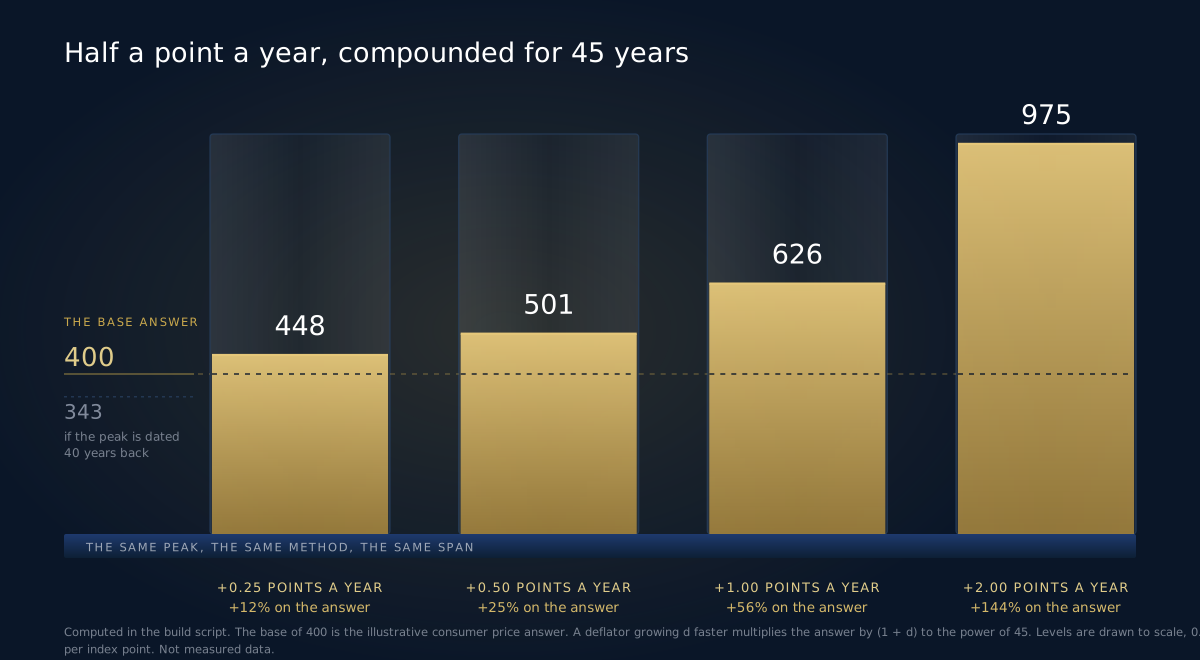
Suppose two analysts agree on the method and disagree only about the series. One uses a national consumer price index, the other a slightly different measure that grows half a percentage point faster each year. Over 45 years that gap compounds to a factor of 1.252.
| Deflator grows this much faster | Over 45 years that is | On a base of 400 | Change |
|---|---|---|---|
| +0.25 percentage points a year | x 1.119 | 448 | +12% |
| +0.50 percentage points a year | x 1.252 | 501 | +25% |
| +1.00 percentage points a year | x 1.565 | 626 | +56% |
| +2.00 percentage points a year | x 2.438 | 975 | +144% |
A quarter of a point a year, which is well inside the range of legitimate methodological disagreement, moves the answer by 12%. A full point moves it by 56%.
The horizon does the same work. Date the peak 40 years back instead of 45, at the identical 3.13% a year, and 400 becomes 343. The choice of which month counts as "the peak" is worth 14% before any argument about deflators begins.
So which one should you use?
Depends what you are asking, and decide that before you run any of them.
Whether gold preserved purchasing power: consumer prices, and accept the smallest answer. Whether it kept pace with monetary expansion: money per ounce, never raw money. Whether it is a constant share of the economy: nominal output, knowing you are handing gold credit for real growth.
Where gold is going: none of them. That is the part worth being blunt about.
What this does to a wave target
Nothing, directly, and the reason matters.
A deflated old high is not a projection. It contains no supply, no demand, no real rate, no positioning and no structure. It is a statement about two units of account. Reading it as a price target is a category error and the most common way this calculation gets misused.
It earns its place as a plausibility band. If a Weekly count projects a level inside the range these methods produce, the monetary background is at least not arguing with you. If a projection lands well outside the widest of them, that is not proof the count is wrong, but it is a prompt to check the degree you assigned.
There is a second use, more practical. Once you accept that a 45 year span involves factors of four and sixteen rather than percentages, reading long-horizon charts in log scale stops being a stylistic preference. Fibonacci relationships measured on a linear axis across four decades are measuring the wrong thing.
How to state a long-horizon level honestly
Four rules, and they cost nothing to follow.
Name the series, not the concept. "Inflation adjusted" is not a series. A specific national index, with its vintage, is.
Name both dates. The month you deflated from and the month you deflated to, because five years at either end is worth double digits.
Publish two of them. One number hides the argument. Two numbers from two methods show the reader how wide the honest range is, and the width is the most useful thing you have to tell them.
Say what it is not. A deflated old high is context. Label it as context and nobody reads it as a forecast.
Where the whole exercise falls apart
Three objections, and the first one is close to fatal.
The peak was a spike. Whatever level you pick was reached briefly, under a specific policy regime and a specific set of positioning, and it was not sustained. Deflating a spike gives you a deflated spike. A monthly average is the more honest input, and it produces a smaller and less quotable number, which is presumably why nobody uses it.
Broad money is not one thing. The definitions have been revised and the components have changed, so the series is not consistently comparable across 45 years in any country. That is exactly the objection people level at consumer price indices, and it applies at least as hard here.
Gold's role changed inside the window. The world at the start of the span was seven years past the move to generalized floating. Assuming the same fraction of money or output belongs in gold at both ends is an assumption about behaviour rather than a measurement of it.
None of that makes the calculation worthless. It makes it a range you have to argue for rather than a number you can look up.
Quick facts
- Deflating an old high is a question about what you want held constant, not a single calculation with a single answer.
- On the illustrative inputs, a peak of 100 becomes 400 on consumer prices, 640 on money per ounce, 1,200 on nominal output and 1,600 on broad money.
- The spread between the lowest and highest answer is 4.0 times, and all of it comes from the choice of deflator.
- The implied annual rates behind those factors run from 3.13% to 6.36%, a range nobody would find remarkable in a single year.
- The money-adjusted figure quoted in most articles omits the growth in above-ground metal, which cuts it by 60% on these inputs.
- Deflating by the metal stock alone gives 40, which is not defensible either. It belongs inside another method.
- A deflator growing half a percentage point faster a year changes the 45 year answer by 25%.
- Dating the peak 40 years back instead of 45 at the same rate turns 400 into 343.
Frequently asked questions
Which method do most published figures use? Consumer prices, usually without naming the index or the vintage. It is the smallest of the four answers here, which is worth knowing next time you see a headline claiming the adjusted peak has never been exceeded. A defensible variant, the monthly average peak, may already have been exceeded.
Is the money-based number just wrong? Incomplete rather than wrong. Money grew, and so did the number of ounces the money is chasing. Correct for both and you get 640 on these inputs instead of 1,600. If someone quotes you the money-adjusted peak, ask whether they divided by the metal stock.
Does a different country's inflation series change things? Substantially, and that is a feature. Gold's purchasing power is a different question in each currency, and the answer differs because the currencies do. Pick the one you actually spend, then say which one you picked.
Why not use real interest rates instead? Because that is a different kind of model. Real rates explain demand at a point in time and are not a unit conversion, which is what a deflator is. You can build a case from real rates. You cannot restate an old high with them.
Should any of this appear in a trade plan? Only as a boundary check. Long-horizon levels come from structure and from Fibonacci projections off a completed pattern. A deflated peak never sets an entry, a stop or a target.
When the data file arrives, will there be one number? No, and the article will say so. There will be four, each labelled with its series, its vintage and its two dates. Anyone wanting a single number is asking the arithmetic to make an editorial decision for them.
A DEFLATED HIGH IS CONTEXT. A COUNT IS A TRADE. EW Strategy publishes daily Elliott Wave analysis across 27 instruments, 11 FX pairs, 4 commodities, 5 indices and 7 crypto, on H4, Daily and Weekly. Annotated PDF reports on XAUUSD and the metals complex, EWS Helix on WhatsApp when a Weekly level gives way, and the Fibonacci calculator for building long-horizon projections from structure rather than from a deflator.
Further reading
Frequently asked questions
What is Elliott Wave analysis?+
Elliott Wave analysis is a form of technical analysis based on the theory that financial markets move in predictable wave patterns reflecting crowd psychology. Markets advance in five-wave impulse patterns and correct in three-wave patterns.
How accurate is Elliott Wave analysis?+
Accuracy depends on the analyst's skill, the instrument, and how the result is measured. At EW Strategy, every published call carries a direction, target levels and an invalidation level stated in advance, and every outcome is recorded against them. We are rebuilding that record from the raw archive under a measurement rule published before any figure, and we would rather show nothing than a headline number we cannot defend.
Can Elliott Wave analysis be used for day trading?+
Yes. Elliott Wave patterns appear at all timeframes, from 1-minute charts to monthly charts. Day traders typically focus on sub-minuette and minuette degree waves for intraday setups.
Elliott Wave analyst with 15+ years of experience. Covers 27 instruments daily across Forex, Commodities, Indices and Crypto. Founder of Artavest Oy, Helsinki.