AUDUSD Elliott Wave: Wave (4) Noise Before Wave (5) Up
One of the biggest challenges in trading is keeping it simple.
Most traders lose money inside corrections because they try to trade every wiggle instead of waiting for the structure to finish.
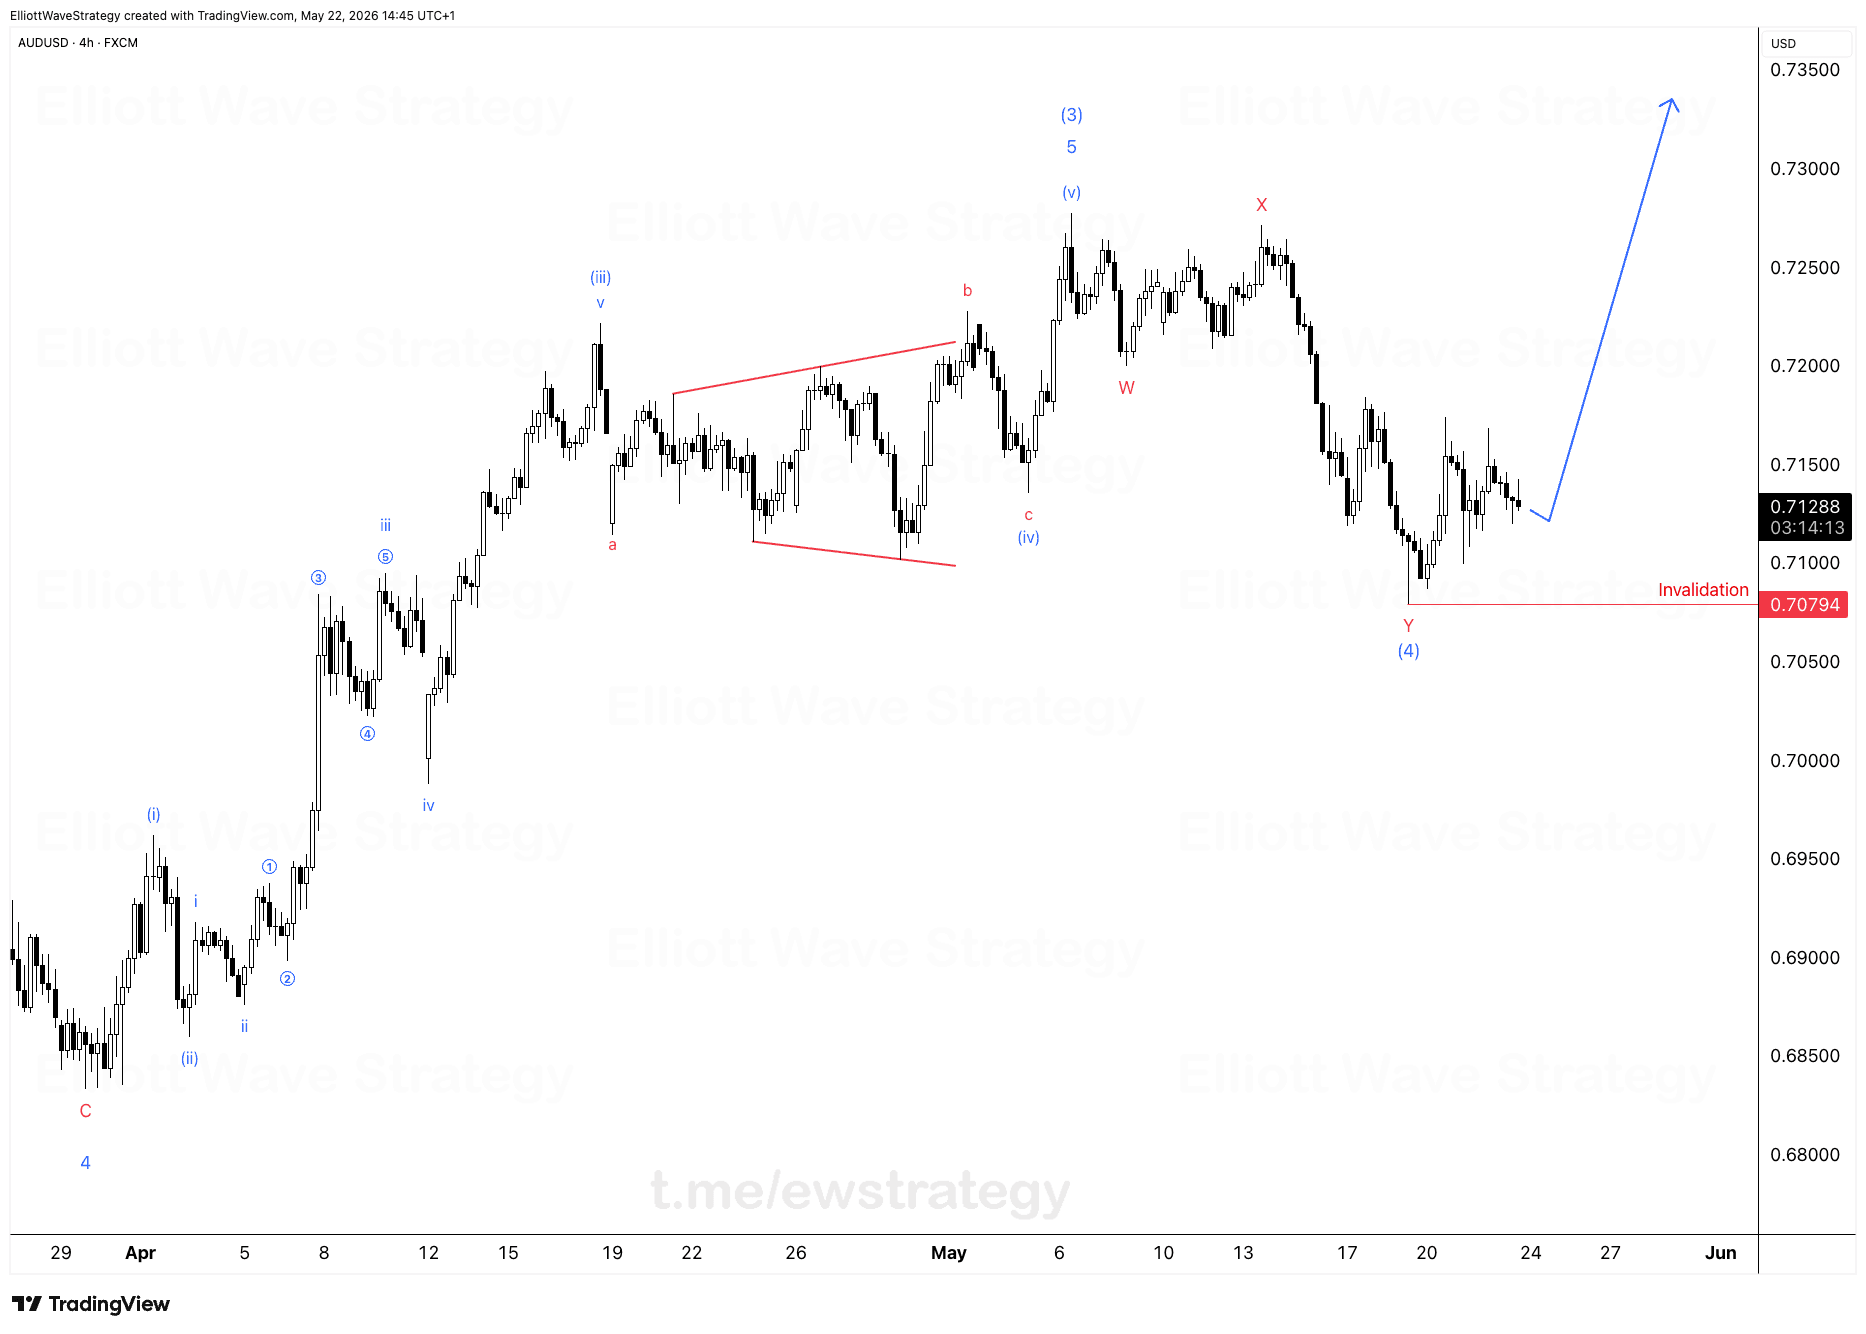
AUDUSD on the 4h chart is a perfect example. Price is stuck in a WXY correction labeled as Wave (4), and it looks messy up close. Zoom out and the picture is simple: this is a pullback inside a bigger uptrend, not a new bearish trend.
The impulse from the lows is labeled cleanly. Wave 3 with its five internal sub-waves already completed, wave 4 pulled back, and wave 5 pushed price up into the high before the current correction started. That five-wave rally is the reason the bigger trend is still up. Wave (4) is just the market catching its breath before Wave (5) launches toward new highs.
Why does the WXY correction look so complicated?
A WXY is a double correction: three-wave move (W), a connector (X), then another three-wave move (Y). On this chart, W formed as a zigzag with an a-b-c structure, X marked the high around 0.725, and Y is a contracting triangle that dipped into the 0.708 area before turning up.
That contracting triangle inside wave c is exactly the kind of structure that gets traders chopped up. Price wiggles inside the triangle boundaries, retail traders try to scalp every swing, and most of them get stopped out because there's no clean impulse to trade yet. The triangle is corrective by nature. It's not meant to be traded like a trend.
What does the invalidation level at 0.70794 actually mean?
The invalidation level is the line in the sand for this entire bullish count. As long as price holds above 0.70794, the WXY correction in Wave (4) remains valid and the setup for Wave (5) higher stays intact.
If price closes below that level, the current wave count breaks down and the bullish structure needs to be reassessed. This is not a stop-loss suggestion, it's the technical point where the Elliott Wave labeling stops working.
What happens after Wave (4) completes?
Once the WXY correction finishes, the next move should be an impulsive five-wave rally higher, labeled Wave (5) on the chart. The drawn projection on the chart points toward new highs above 0.735, well beyond the wave (3) peak.
The job right now isn't guessing where Y ends to the pip. It's recognizing that the bigger trend on the higher timeframe is up, and waiting for price to break out of the corrective noise before trading the impulse that follows.
The bigger lesson from this AUDUSD chart
Trading becomes far easier when you separate timeframes properly. Identify the trend direction on the higher timeframe first. Then trade the impulsive moves on the lower timeframe, and ignore the corrective chop in between.
AUDUSD right now is telling that story clearly. The trend is up, Wave (4) is corrective noise, and the invalidation at 0.70794 is the only number that matters until Wave (5) confirms itself with a clean impulsive breakout.
Key Takeaways
- •AUDUSD is completing a WXY correction labeled Wave (4) inside a larger uptrend.
- •The invalidation level for the AUDUSD bullish count sits at 0.70794.
- •A contracting triangle inside wave Y is the source of the choppy price action traders keep getting stopped out on.
- •Once Wave (4) completes, AUDUSD is expected to launch a five-wave Wave (5) impulse toward new highs.
- •The higher timeframe trend on AUDUSD remains up despite the messy correction on the 4h chart.
Frequently Asked Questions
What invalidates the bullish AUDUSD Elliott Wave count?
A close below 0.70794 would invalidate the current Wave (4) correction count and require the structure to be reassessed.
Why does AUDUSD look choppy right now?
Price is inside a WXY correction with a contracting triangle in wave Y, which produces overlapping, non-directional price swings by design.
What comes after Wave (4) on AUDUSD finishes?
The expected next move is an impulsive five-wave rally labeled Wave (5), targeting new highs above the prior wave (3) peak.
Disclaimer: This analysis is for educational purposes only and does not constitute financial advice. Elliott Wave analysis involves subjective interpretation. Always do your own research and manage your risk accordingly.
Get Full Coverage for All 27 Instruments
Premium members receive daily wave counts with entry zones, targets and invalidation levels, published daily across all 27 instruments.
View Premium Plans