BNBUSDT Elliott Wave: Triangle in Wave 4 Still Building
The hardest part of trading is having the discipline to wait for the pattern to fully complete. Never force a trade while the market is deciding.
The hardest part of trading isn't finding the setup. It is having the discipline to wait for the pattern to fully complete.
BNBUSDT on the 4h chart is a good example right now. Price has been carving out a corrective structure since wave 3 bottomed, and the count is not asking anyone to guess. It is asking traders to wait.
What does the BNBUSDT chart show right now?
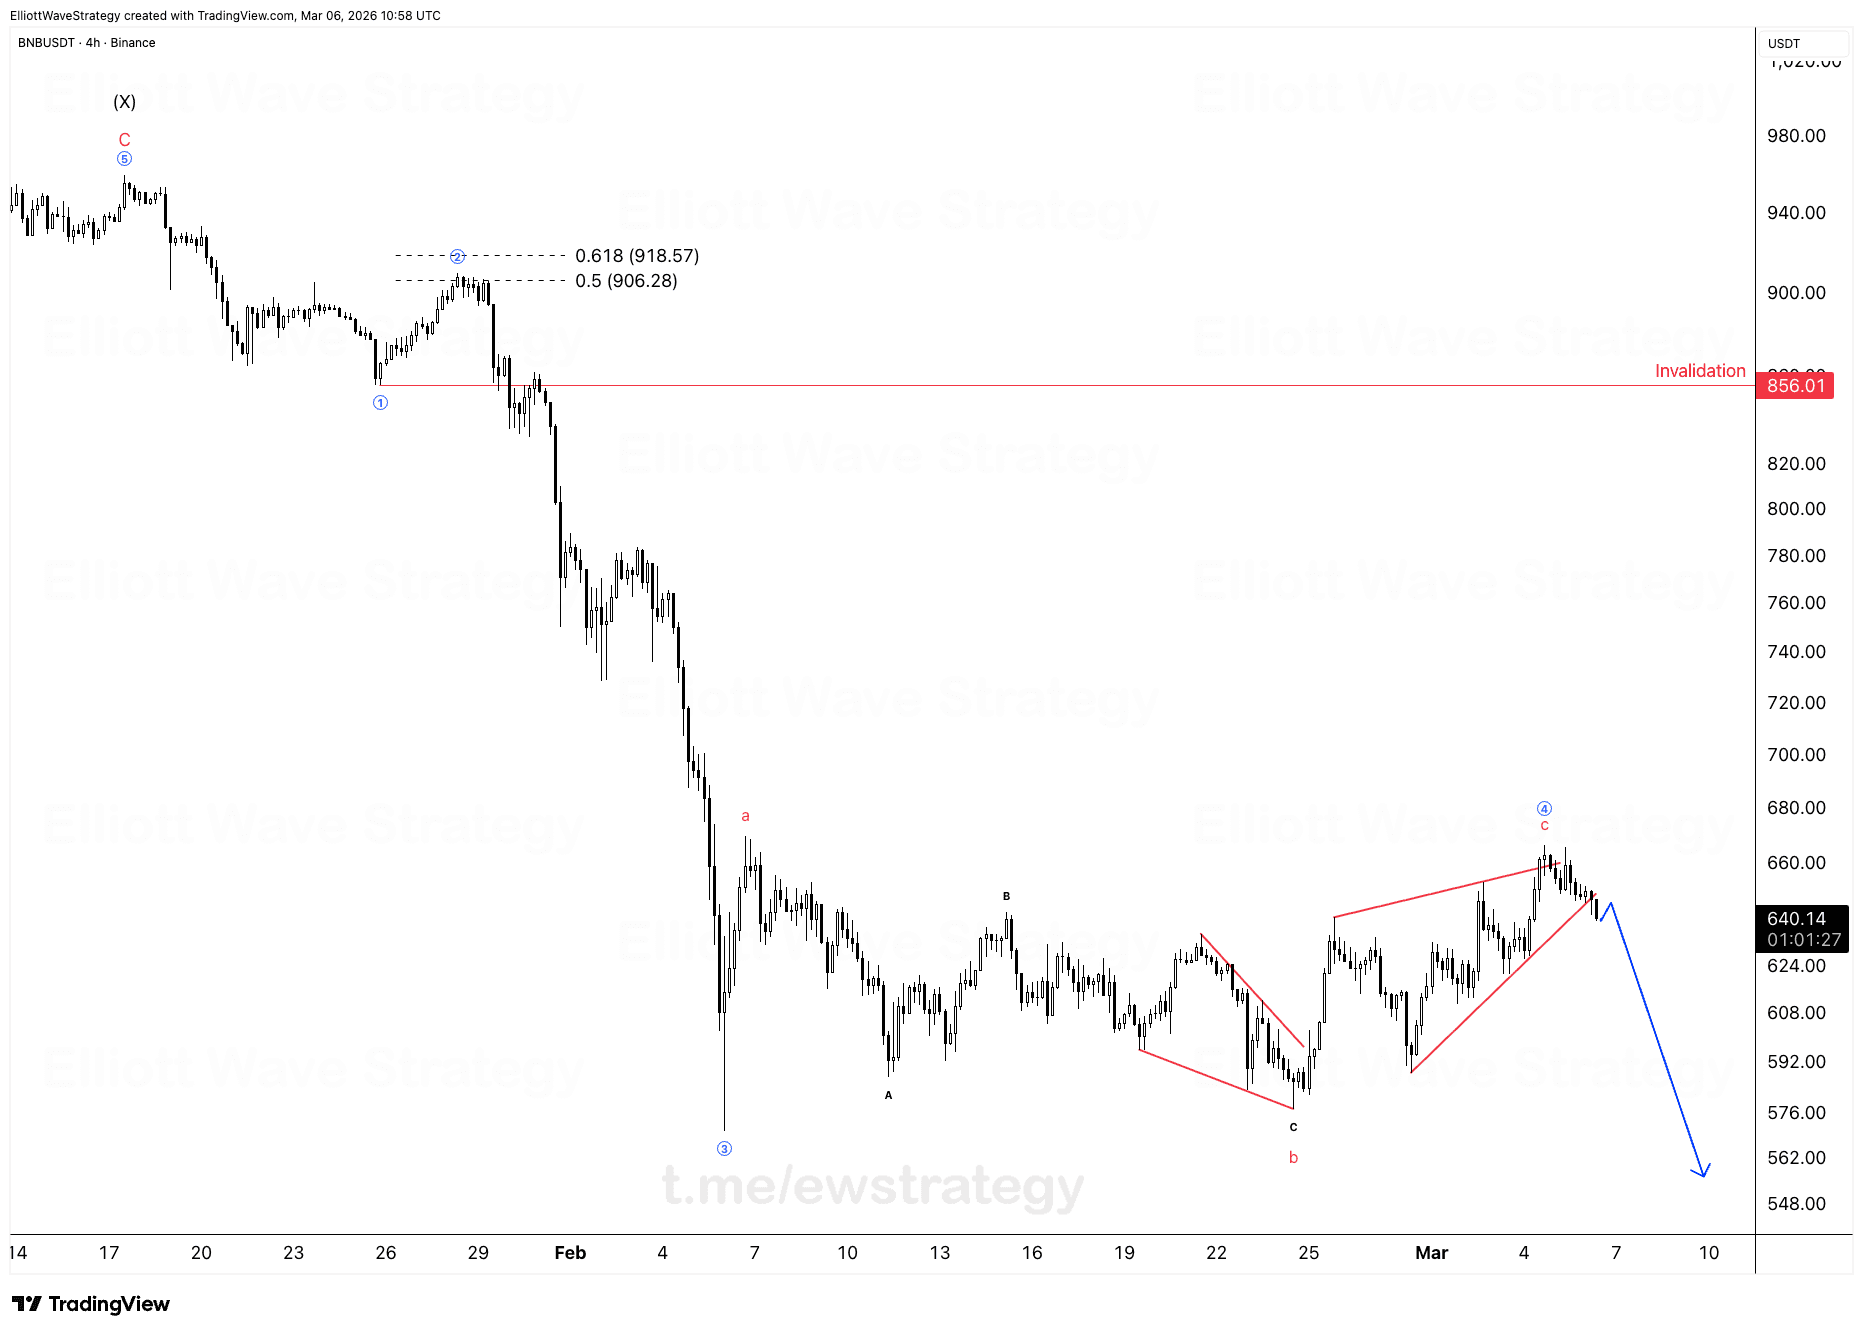
The move down from wave 2 into wave 3 was sharp and impulsive, dropping from the 906 to 918 zone straight into the low near 578. That kind of decline does not leave much room for doubt about direction.
Since that wave 3 low, BNBUSDT has been building a corrective sequence labeled A, B, C, and now what looks like a wave 4 triangle. The red trendlines on the chart mark out the contracting shape: lower highs from wave B into the C leg near 660, and higher lows from the C low near 578 back up.
Why does the triangle matter for wave 4?
A contracting triangle is a classic wave 4 pattern. It shows the market chopping sideways, squeezing between converging trendlines, while neither buyers nor sellers commit to a clean breakout.
That is exactly the kind of environment where forcing a trade gets punished. Every touch of the upper or lower trendline looks like a signal until it fails and price snaps back inside the range.
The blue arrow on the chart marks the projected path once the triangle resolves: a break lower, continuing the wave 4 correction toward new lows below the C leg. But that projection only matters once price actually breaks the triangle boundary, not before.
Where does the bearish wave 4 count get invalidated?
The invalidation is marked directly on the chart at 856.01. That level ties back to the wave 2 high and the 0.5 to 0.618 retracement zone between 906.28 and 918.57.
As long as price stays below that zone, the larger structure down from wave 2 into wave 3 and now wave 4 remains intact. A close back above 856.01 would force a rethink of the whole count.
Why wait for the break instead of trading the triangle edges?
Never force a trade while the market is deciding. Triangles are designed to shake out early entries on both sides before the real move starts.
Wait for the break, execute the plan, and let the trend do the heavy lifting. The BNBUSDT chart lays out a level to invalidate against and a projected path if the triangle breaks down, but neither replaces the confirmation of an actual breakout candle closing outside the pattern.
That discipline, doing nothing until the pattern actually completes, is the difference between trading the plan and trading your impatience.
Key Takeaways
- •BNBUSDT is forming a wave 4 contracting triangle above the March low, following an impulsive wave 3 decline.
- •The invalidation level for the bearish BNBUSDT count sits at 856.01, tied to the 0.5 and 0.618 retracements of wave 2.
- •A confirmed break below the triangle's lower trendline would support the projected move toward new lows on BNBUSDT.
- •Trading triangle edges before a confirmed break exposes traders to repeated false signals.
- •The current structure requires patience: wait for the breakout candle before assuming the wave 4 correction has resolved.
Frequently Asked Questions
What invalidates the bearish BNBUSDT wave 4 count?
A close back above 856.01 would invalidate the current wave 4 triangle count, since that level lines up with the 0.5 to 0.618 retracement of the prior wave 2.
Why is BNBUSDT trading sideways instead of trending?
The sideways action reflects a wave 4 contracting triangle, a corrective pattern where price chops between converging trendlines before the next directional move.
Should you trade the edges of the BNBUSDT triangle?
Trading the upper or lower trendline before a confirmed breakout is risky, since triangles are known for false touches on both sides before the real move develops.
Disclaimer: This analysis is for educational purposes only and does not constitute financial advice. Elliott Wave analysis involves subjective interpretation. Always do your own research and manage your risk accordingly.
Get Full Coverage for All 27 Instruments
Premium members receive daily wave counts with entry zones, targets and invalidation levels, published daily across all 27 instruments.
View Premium Plans