EURAUD Elliott Wave: Wave (4) Triangle Nears Wave E
The biggest mistake in trading isn't bad analysis. It's trading too much.
The biggest mistake in trading isn't bad analysis. It's trading too much.
20, 30, 40 trades a month isn't a strategy. That's dopamine, and your account pays for every hit. EURAUD right now is a perfect example of a chart built to bait that behavior.
What is EURAUD's Wave (4) triangle doing?
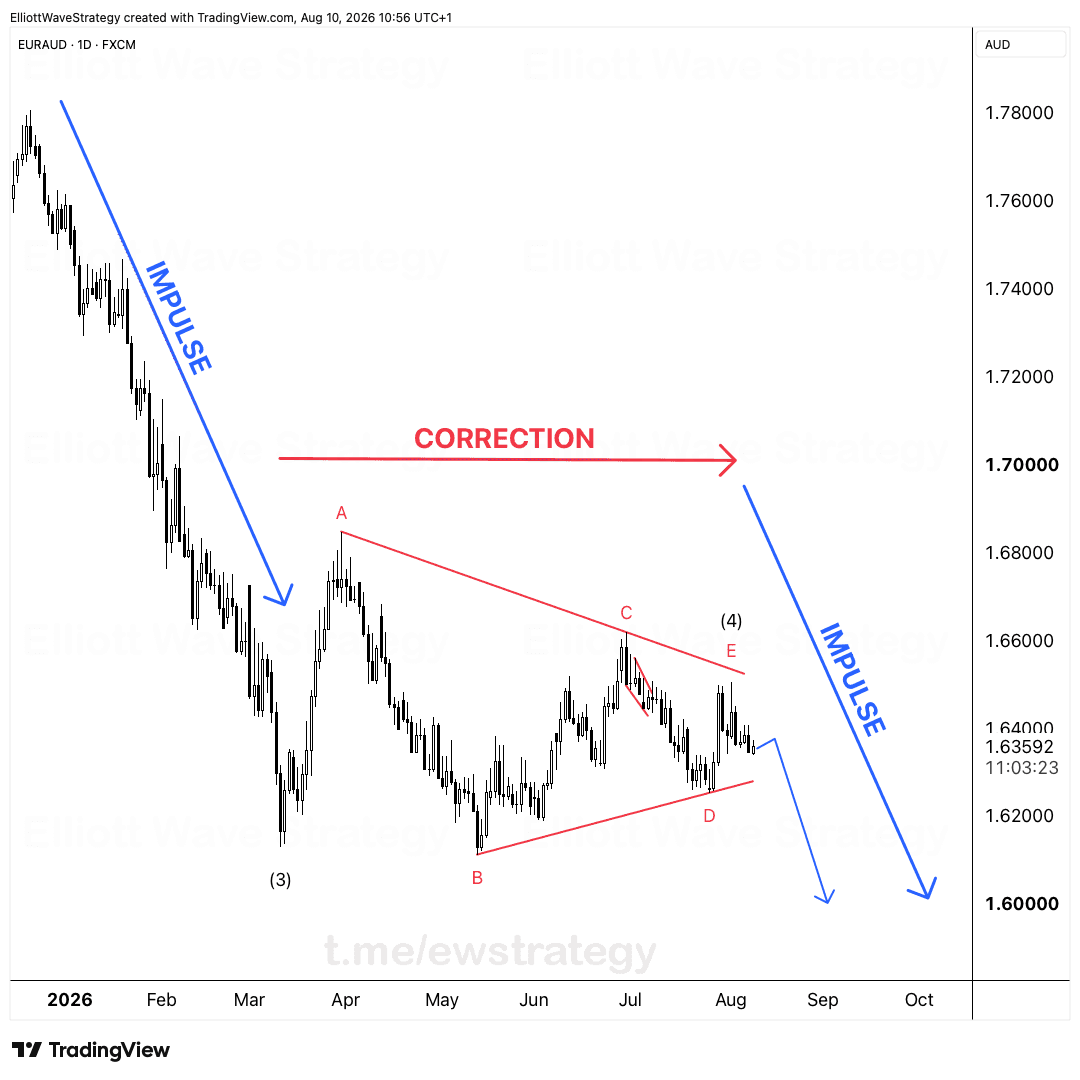
Wave (3) finished its impulse down in January. Since then, EURAUD has been carving out a Wave (4) correction for four straight months.
The structure is A, B, C, D, E: a contracting triangle grinding sideways. Wave A topped, Wave B pushed down, Wave C rallied back up toward the A-C trendline, Wave D dipped lower, and price is now working on Wave E inside a shrinking range.
Each leg is smaller than the last. That's the signature of a triangle: volatility compresses, and the price action gets choppier and more boring by the week. That boredom is exactly what drives traders to overtrade.
Why does a contracting triangle push people to overtrade?
Four months of sideways chop tests patience harder than a clean trend ever does. Every small bounce inside the triangle looks like a breakout. Every small dip looks like the start of the next impulse.
None of it is. Trading the chop inside a triangle before it resolves is how accounts bleed out on fees and false starts.
We're not bored. We're hunting. Trading is mostly waiting, and this chart is a waiting game until Wave E is done.
What happens once Wave E completes?
Once Wave E finishes and price confirms the break below the triangle, the next impulse lower begins. On the chart, that's the move projected down toward the 1.60000 region, continuing the same directional impulse structure that drove Wave (3) down in January.
We follow our scenarios and sit still until conditions actually form. No chasing the chop inside the triangle. No forcing an entry because "it's been four months already." The setup is the break of the triangle, not any wiggle before it.
What does this mean for how you trade EURAUD right now?
When the setup isn't there, we don't take one. That's still a good month.
The triangle on EURAUD isn't done until Wave E completes and the break confirms. Until then, every candle inside the triangle is noise, not signal.
Patience with this kind of structure isn't a personality trait, it's the strategy itself. The traders who wait for the E wave to finish and the break to confirm are the ones positioned for the next impulse. The traders who force trades inside the triangle are funding the ones who wait.
Key Takeaways
- •EURAUD has been building a Wave (4) contracting triangle for four straight months since Wave (3) bottomed in January.
- •The triangle structure on EURAUD follows an A, B, C, D, E sequence, with each leg smaller than the last.
- •Overtrading the chop inside EURAUD's triangle before it resolves is the mistake, not the analysis itself.
- •A confirmed break after Wave E completes on EURAUD would signal the start of the next impulse lower.
- •Waiting for the setup to actually form on EURAUD, even through months of sideways chop, is still a valid strategy.
Frequently Asked Questions
What wave pattern is EURAUD in right now?
EURAUD is inside a Wave (4) contracting triangle that has been forming since January, moving through an A, B, C, D, E sequence.
What would confirm the next move lower on EURAUD?
A confirmed break of the triangle structure after Wave E completes would signal the start of the next impulse lower, continuing the trend that produced Wave (3).
Why not trade the moves inside the EURAUD triangle?
Price action inside a contracting triangle is chop by nature, with shrinking legs that create false breakout signals until the pattern actually resolves.
Disclaimer: This analysis is for educational purposes only and does not constitute financial advice. Elliott Wave analysis involves subjective interpretation. Always do your own research and manage your risk accordingly.
Get Full Coverage for All 27 Instruments
Premium members receive daily wave counts with entry zones, targets and invalidation levels, published daily across all 27 instruments.
View Premium Plans