EURUSD Elliott Wave: Wave 4 Correction Still Not Done
The correction is still alive. Don't rush the entry.
The correction is still alive. Don't rush the entry.
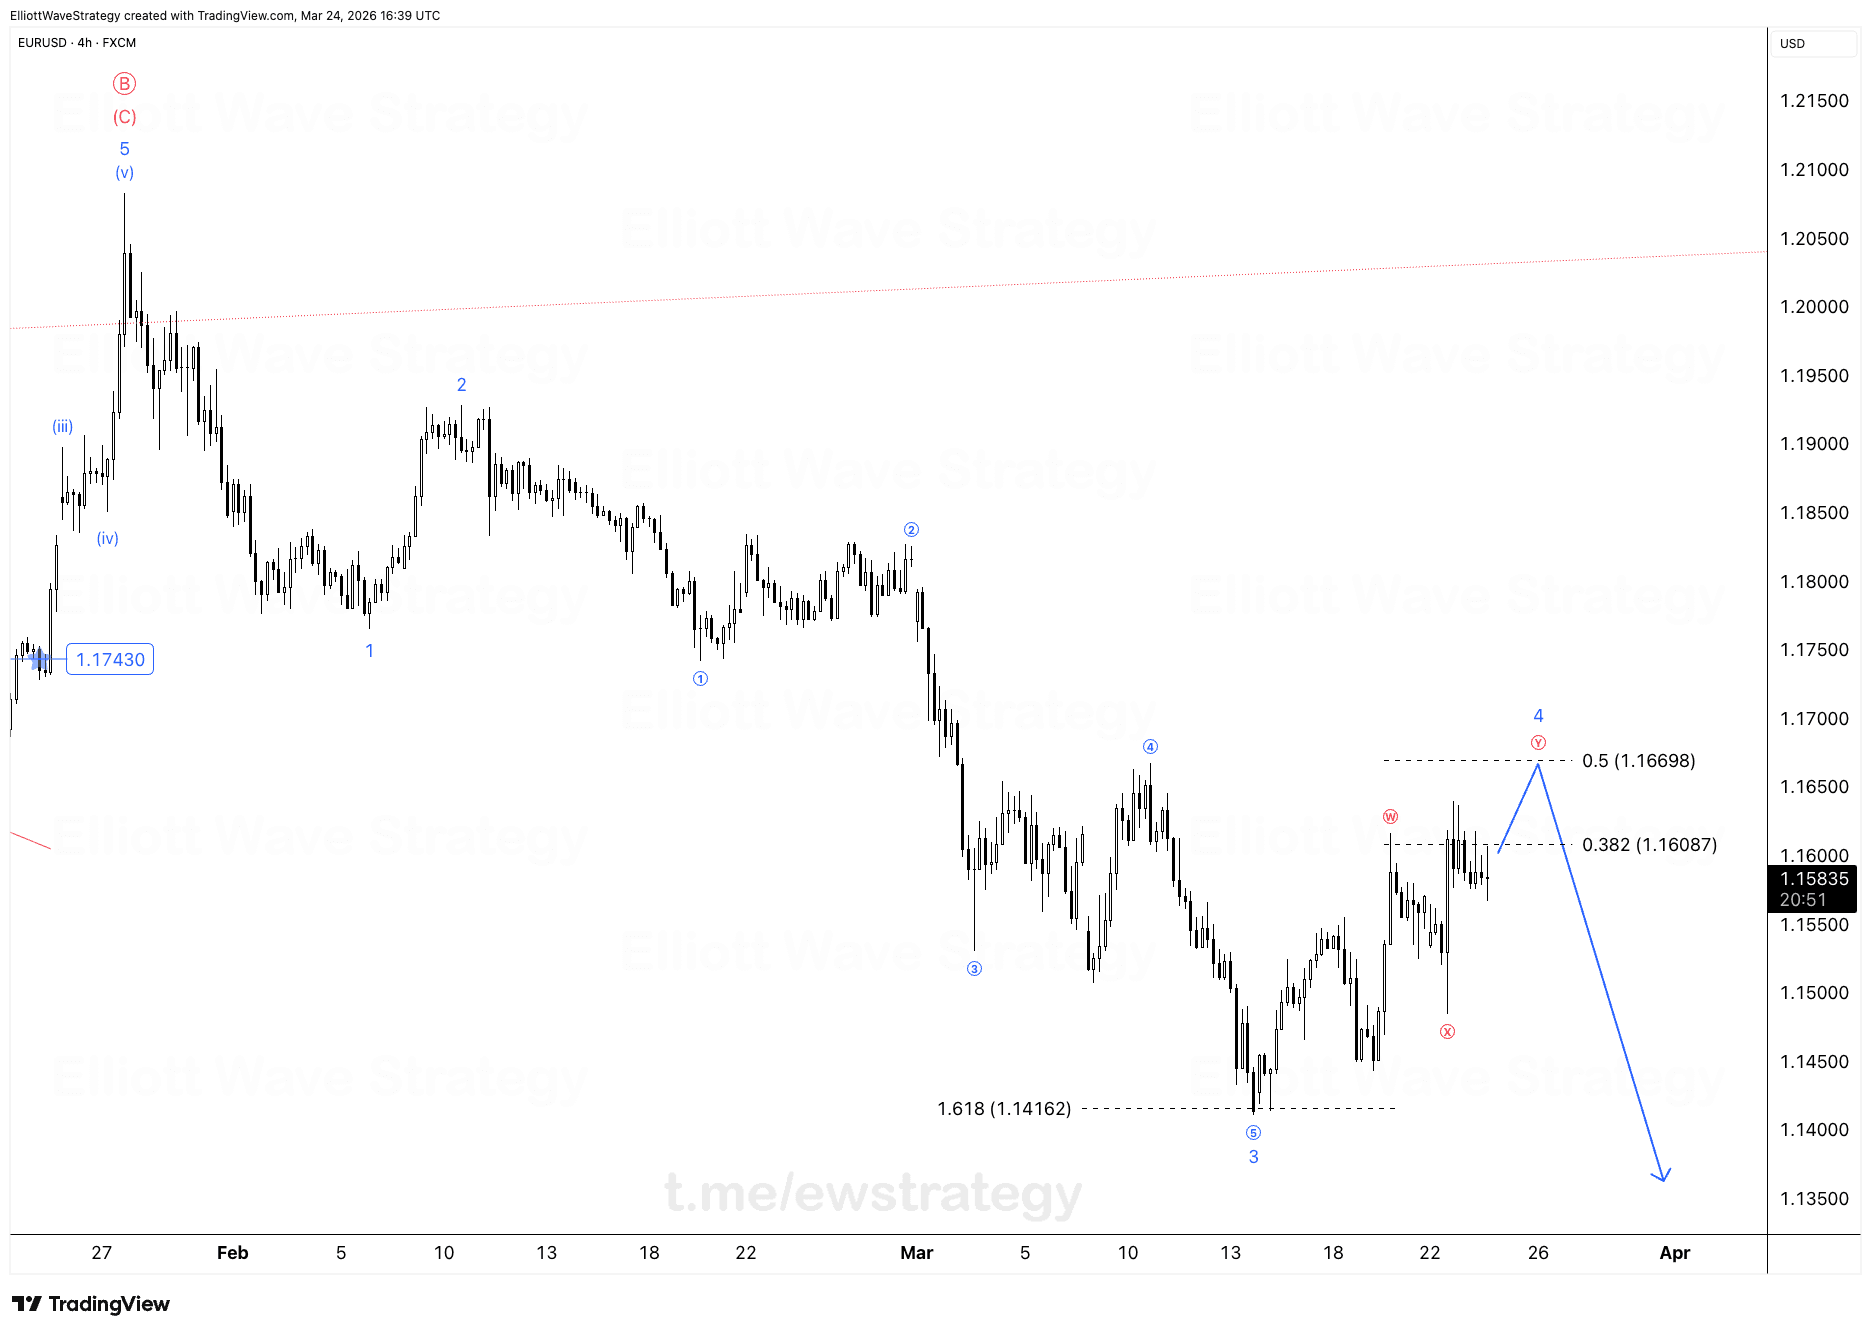
EURUSD bounced off 1.14162, the 1.618 extension of the decline, and traders are already itching to call the bottom. Slow down. That bounce looks corrective, not impulsive, and corrective structures have a nasty habit of dragging on longer than anyone wants.
Why is EURUSD Wave 4 taking so long to resolve?
Wave 4 is painting a complex structure. On the chart it's labeled as a double correction: Wave W down, Wave X back up, and now Wave Y unfolding higher. That's three separate legs instead of one clean move, and each leg resets the clock on patience.
Complex fourth waves exist to punish early positioning. The overlapping candles since Wave X show exactly that: choppy, directionless price action that chews up stop losses on both sides. This is what separates professionals from amateurs. We don't chase every 50-pip wiggle.
Where does Wave Y end?
Current price action shows EURUSD is likely inside Wave Y of the 4th wave. The chart marks two Fibonacci retracement levels above: 1.16087 at the 0.382 and 1.16698 at the 0.50 retracement. The drawn projection on the chart points toward the 1.16698 zone before the correction finishes and the larger downtrend resumes.
That projected path also shows the next leg reversing hard, aiming back down toward the 1.13500 area once Wave 4 completes and Wave 5 takes over. Nothing here is impulsive yet, and that distinction matters. Corrective waves retrace in three-wave sequences (A-B-C or W-X-Y), while impulsive waves drive in five. Mixing the two up is how traders get trapped buying a correction they mistake for a new trend.
Is this a buy zone for EURUSD right now?
No. The bigger picture remains bearish, and this is not the entry zone yet. It's close, but close isn't confirmed.
Professionals wait for the correction to complete its full cycle before positioning for Wave 5. That means waiting for Wave Y to finish its structure near the marked Fibonacci zone, watching for signs of exhaustion, and only then treating the setup as valid. Jumping in now means trading the noise inside Wave 4, not the trend that follows it.
The prior impulse from late January into mid-March already completed a clean five-wave decline into 1.14162, confirmed by the 1.618 extension hitting almost exactly on the ⑤ label. That's the kind of precision that makes the bearish case credible. It's also exactly why rushing the next entry before Wave 4 finishes would throw away that discipline.
Stay patient. The setup is building, not finished.
Key Takeaways
- •EURUSD's Wave 4 correction is a complex double structure labeled W-X-Y, not a simple single pullback.
- •The bounce from 1.14162, the 1.618 extension low, looks corrective rather than impulsive on EURUSD.
- •EURUSD's projected Wave Y target sits between the 1.16087 and 1.16698 Fibonacci retracement levels.
- •The broader EURUSD trend remains bearish, with Wave 5 downside expected only after Wave 4 fully completes.
- •Chasing small EURUSD bounces inside Wave 4 is flagged as an amateur mistake rather than a valid setup.
Frequently Asked Questions
Is EURUSD in a bullish or bearish Elliott Wave structure?
The larger trend is bearish. The current bounce is viewed as a corrective Wave 4, meaning the bigger five-wave decline is expected to resume in Wave 5 once this correction finishes.
What would invalidate the bearish EURUSD count?
A sustained impulsive move well beyond the 0.50 retracement near 1.16698, especially one showing five-wave structure rather than overlapping corrective action, would undermine the current Wave 4 labeling.
Why hasn't EURUSD reached a valid entry zone yet?
Wave Y of the correction hasn't completed its projected structure near the marked Fibonacci levels, and positioning before that completion means trading inside the correction rather than the next impulsive move.
Disclaimer: This analysis is for educational purposes only and does not constitute financial advice. Elliott Wave analysis involves subjective interpretation. Always do your own research and manage your risk accordingly.
Get Full Coverage for All 27 Instruments
Premium members receive daily wave counts with entry zones, targets and invalidation levels, published daily across all 27 instruments.
View Premium Plans