GBPAUD Elliott Wave: Why 1.92574 Voids the Bearish Count
Risk Management: The Only Thing Standing Between You and Account Destruction 💀
You can have the most accurate analysis in the world. You can map every Elliott Wave perfectly. But without strict risk management, you will eventually blow your account.
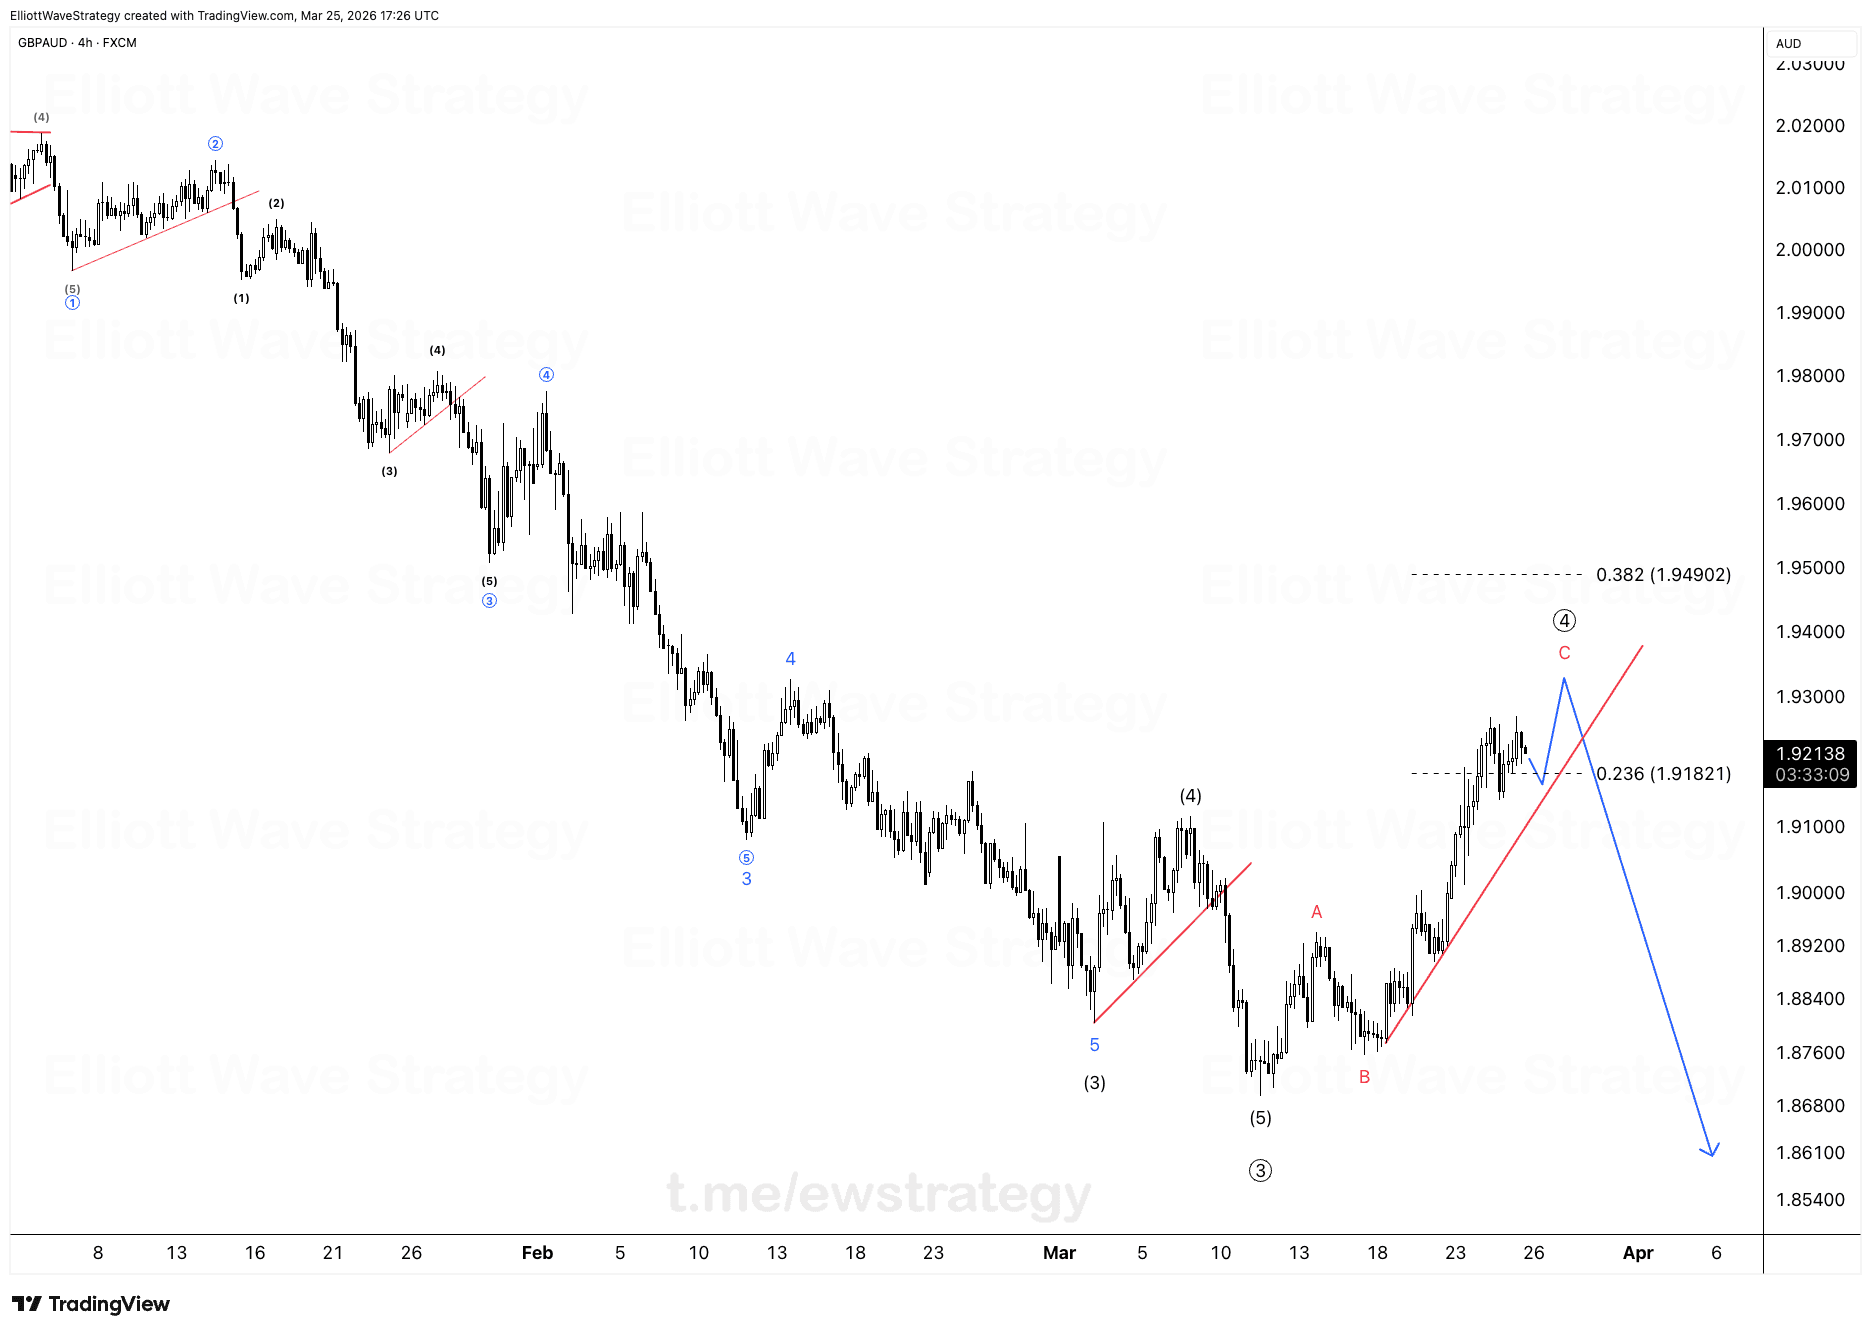
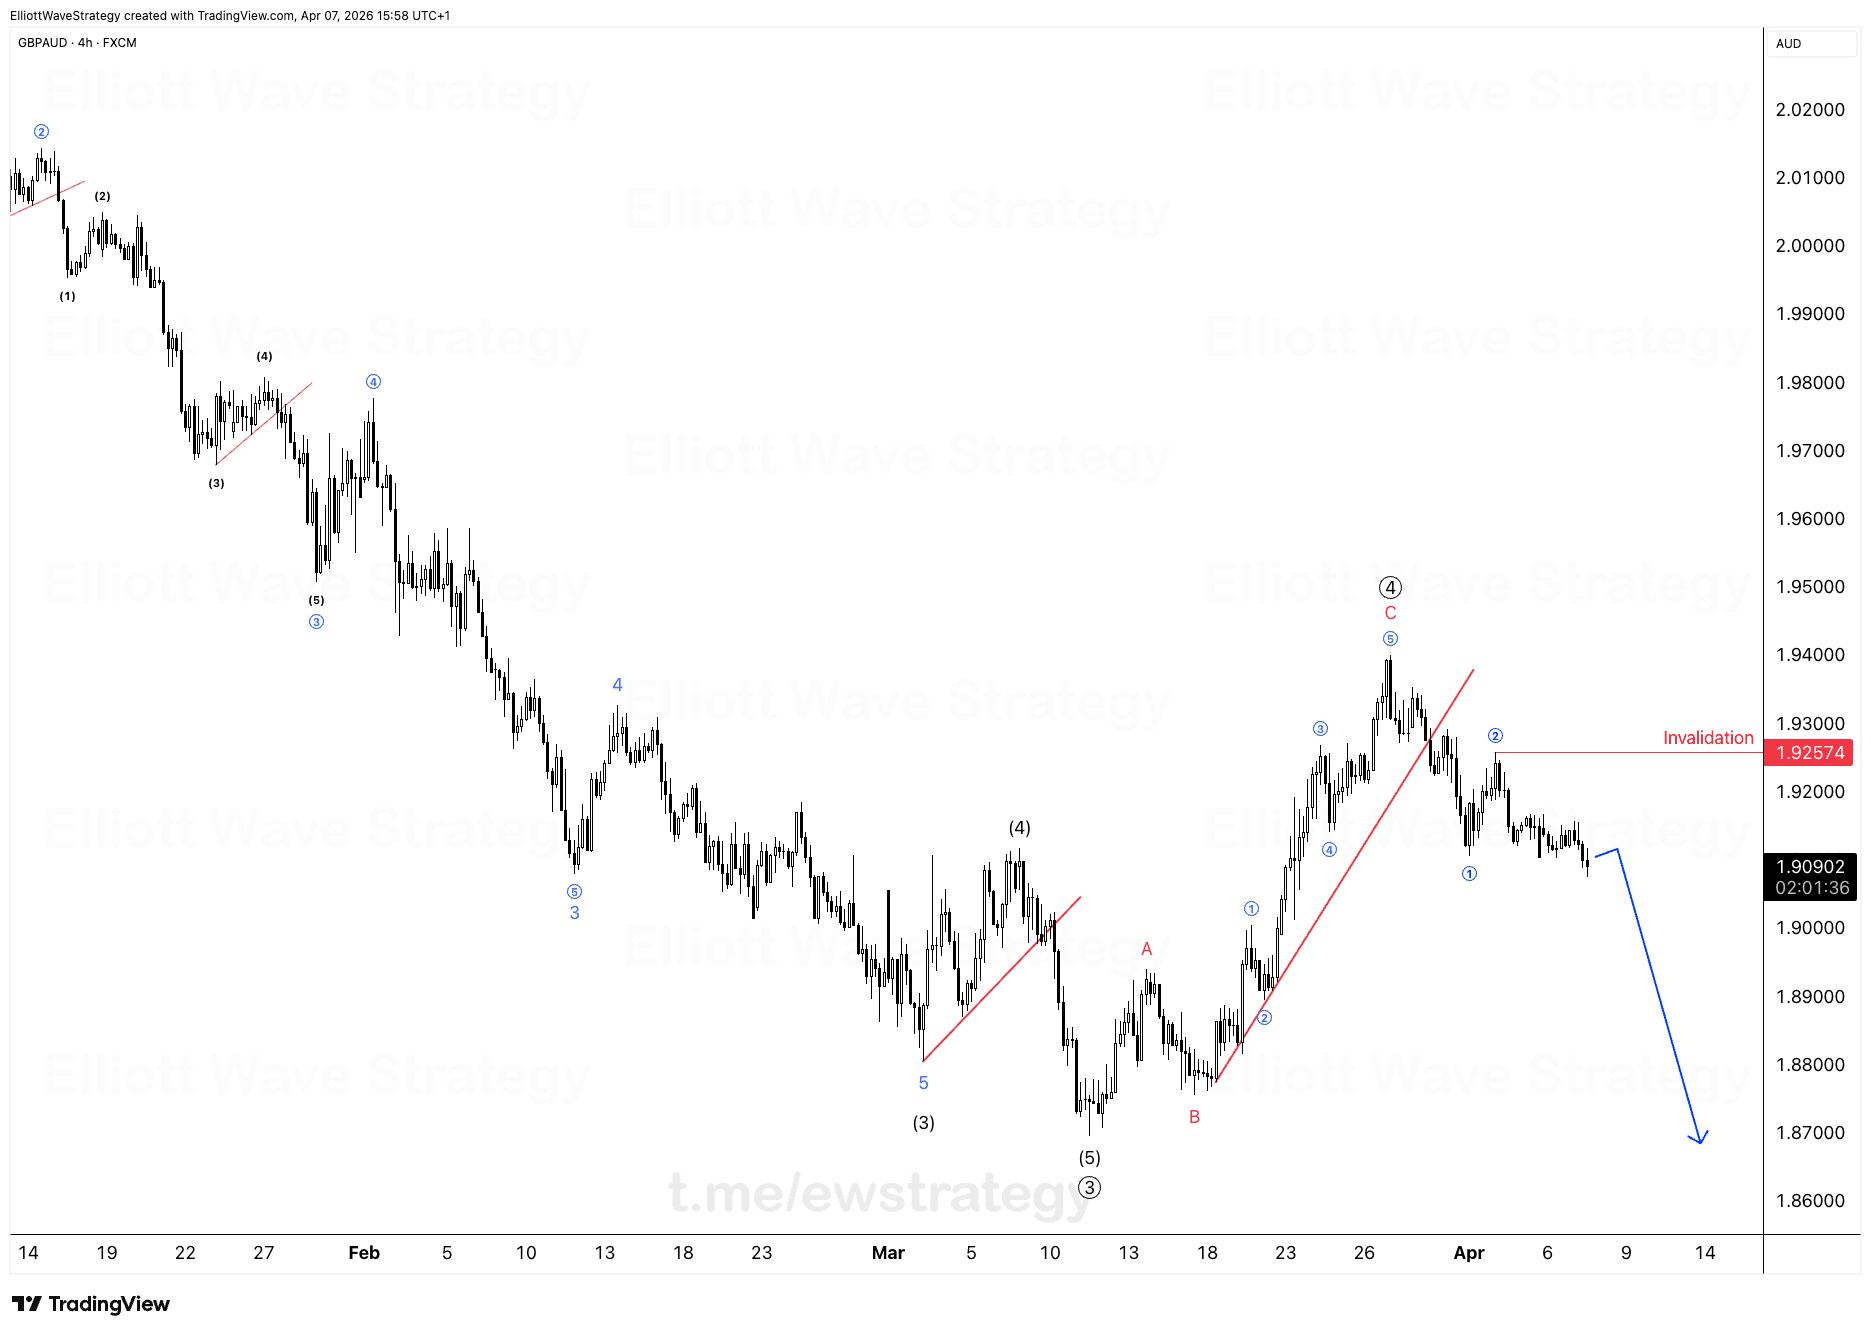
GBPAUD on the 4H chart is a good example of why the invalidation level matters more than the label. The pair has been grinding lower since the wave (2) top back in mid-January, dropping through waves (3), (4) and (5) of a larger degree impulse. From the wave 3 low, price built an A-B-C correction, then launched a fresh five-wave impulse off wave B that ran into wave (4) near 1.94000.
That rally is now done. Wave 1 has broken down, and price is pushing into what looks like wave 2 of the next impulse lower. This is where the invalidation level comes in, and it is not a detail, it is the whole trade.
What does the GBPAUD invalidation level at 1.92574 mean?
The red line on the chart marks 1.92574. If GBPAUD trades back above that price, the bearish wave count from wave (4) is objectively wrong.
Our number one priority at EWS is not catching every single pip, it is preserving capital. That is exactly why every roadmap we publish comes with a strict invalidation level. When price crosses that line, the structural count is no longer valid, full stop.
We don't hope. We don't pray. We don't widen our stop losses. We accept the small loss and wait for the next high-probability setup.
Why does GBPAUD's structure favor further downside?
Look at the sequence. Wave (3) down was a clean five-wave impulse into the 1.97000 area. Wave (4) corrected back up in a triangle-like structure before wave (5) pushed price down toward 1.88000. That completed the larger five-wave decline.
The bounce that followed is labeled A-B-C, with wave C climbing in five waves (1 through 5) up to wave (4) just under 1.94000. That five-wave rally against the dominant downtrend is corrective in nature relative to the bigger picture, which is why the follow-through decline into wave 1 and now wave 2 fits the larger bearish roadmap.
The blue arrow on the chart shows the expected path if this wave 2 correction completes below 1.92574: a continuation lower, targeting territory well beneath the 1.90000 level.
What happens if GBPAUD breaks above the invalidation?
If price closes back above 1.92574, the wave 2 label is wrong and the entire bearish scenario needs to be scrapped. That does not mean the analysis failed, it means the market told us something new.
Survive the chop. Profit heavily on the impulses. The traders who last in this business are not the ones who guess the most tops and bottoms, they are the ones who cut the wrong ideas fast and let the right ones run.
GBPAUD right now is sitting exactly at that decision point. Wave 2 either holds below 1.92574 and the bearish structure continues, or it breaks above and the roadmap gets rebuilt from scratch.
Final thought
The chart tells a clear story of impulse, correction, impulse. But the number that actually protects your account is 1.92574, not the wave labels. That is the level that separates a valid bearish continuation from a busted count.
Key Takeaways
- •GBPAUD's 4H chart shows a completed five-wave decline from wave (2) into wave (5), followed by an A-B-C corrective rally.
- •The invalidation level for the current bearish GBPAUD count sits at 1.92574.
- •If GBPAUD trades back above 1.92574, the wave 2 count is objectively invalidated and must be discarded.
- •GBPAUD is currently forming what looks like wave 2 of a new impulse lower after wave 1 broke down from the wave (4) high near 1.94000.
- •Strict invalidation levels exist to preserve capital on GBPAUD trades, not to predict every pip of movement.
Frequently Asked Questions
What invalidates the bearish GBPAUD Elliott Wave count?
A move back above 1.92574 invalidates the current bearish wave count on GBPAUD's 4H chart, since that level marks the top of the expected wave 2 correction.
What wave is GBPAUD in right now?
GBPAUD appears to be forming wave 2 of a new impulse lower after completing a five-wave rally (wave C) into the wave (4) high near 1.94000.
Why does Elliott Wave analysis always include an invalidation level?
An invalidation level defines the exact price where a wave count is proven wrong, allowing traders to cut losses quickly instead of hoping a broken structure will still work out.
Disclaimer: This analysis is for educational purposes only and does not constitute financial advice. Elliott Wave analysis involves subjective interpretation. Always do your own research and manage your risk accordingly.
Get Full Coverage for All 27 Instruments
Premium members receive daily wave counts with entry zones, targets and invalidation levels, published daily across all 27 instruments.
View Premium Plans