GBPUSD Elliott Wave: Wave C Correction Nears 0.382 Fib
Cable is testing the limits of the range. Choppy price action, no clean direction yet. This is what late-stage corrections look like.
Cable is testing the limits of the range. Choppy price action, no clean direction yet. This is what late-stage corrections look like.
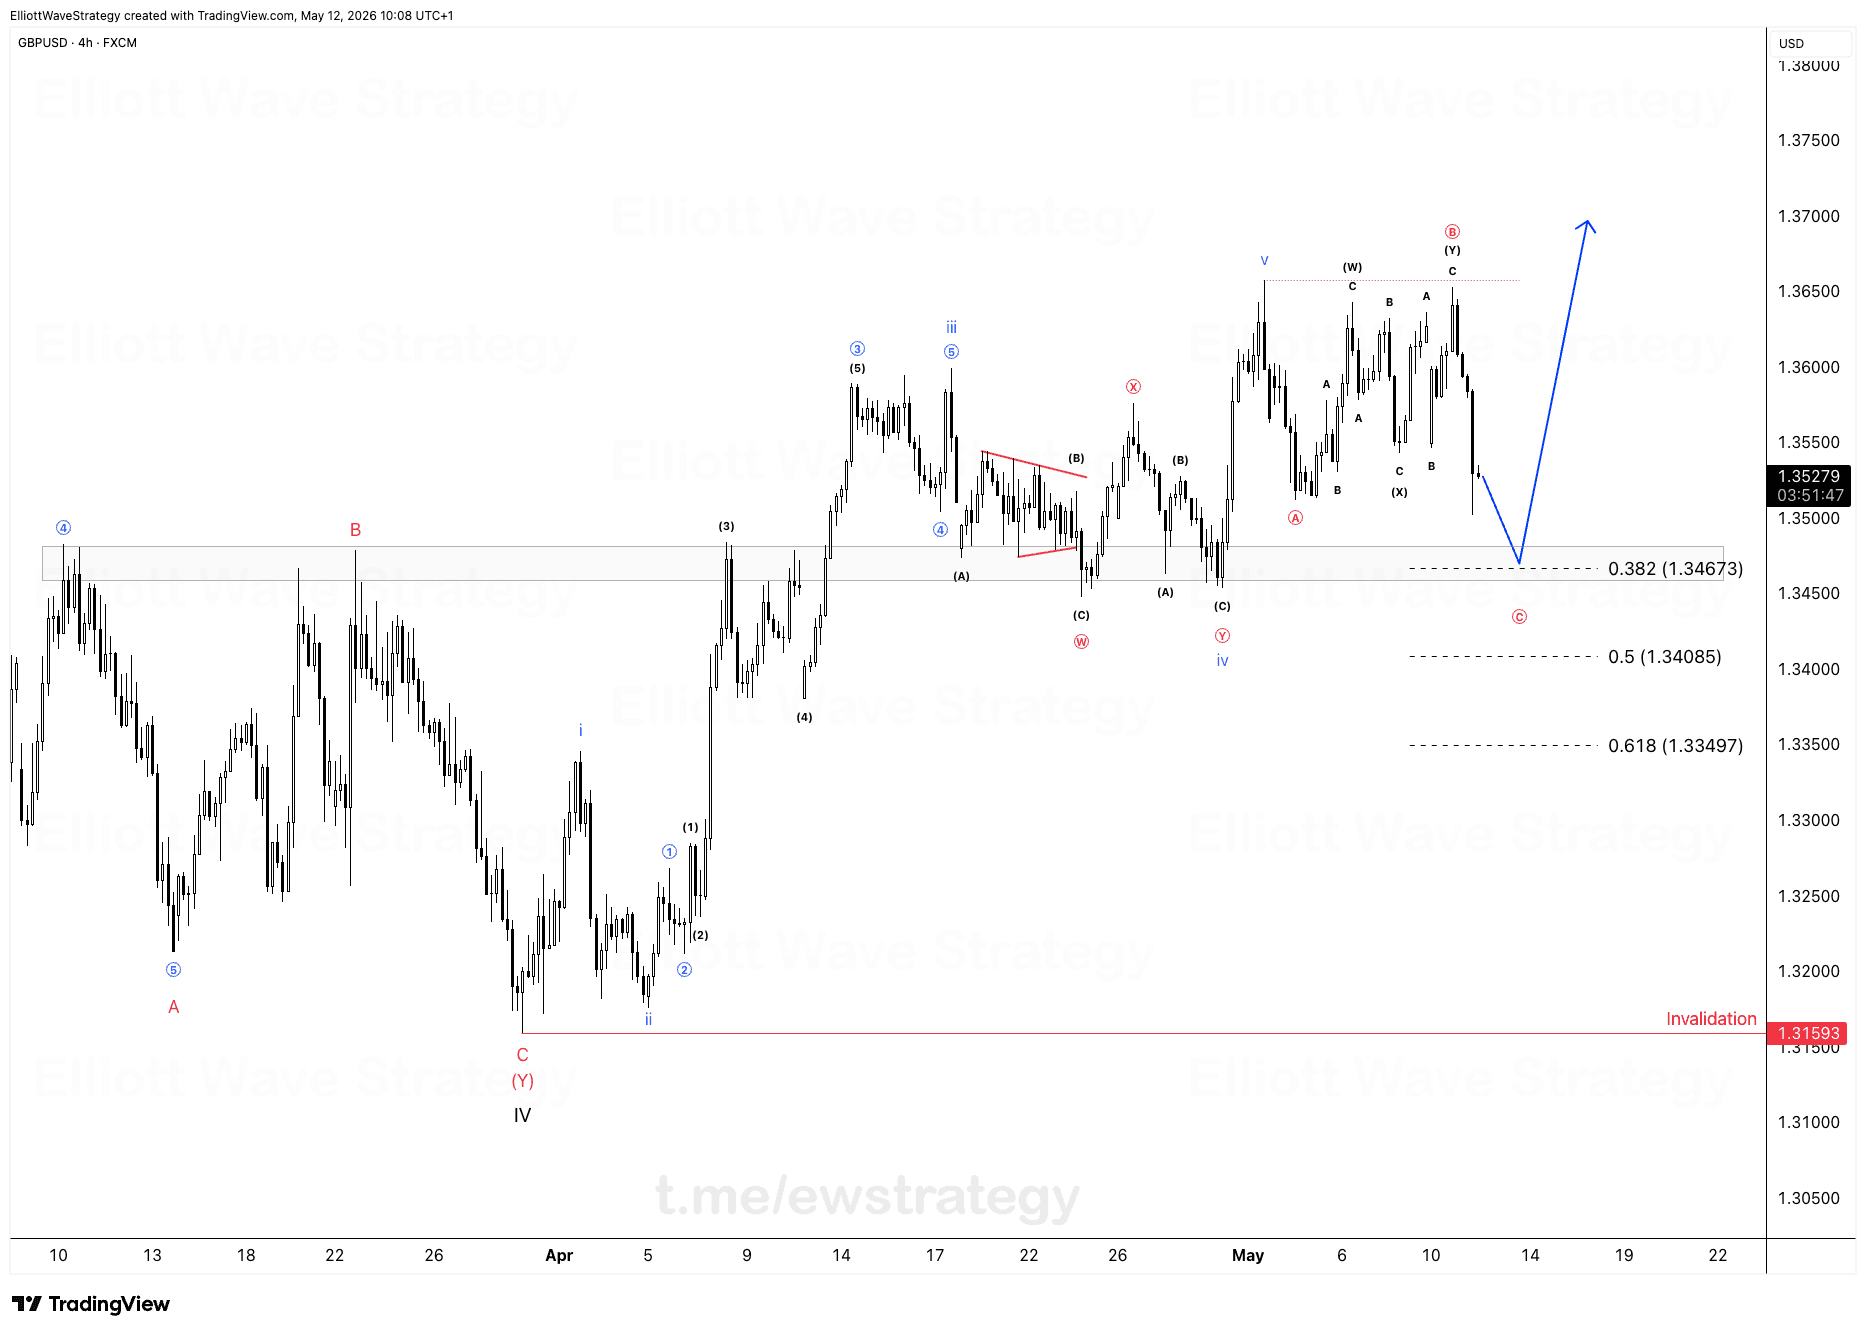
The larger picture stays bullish. Wave V is forming, but first the correction needs to finish. Wave Ⓑ is in. Wave Ⓒ is developing to the downside.
Where is GBPUSD wave C expected to complete?
The zone is the 0.382 Fib retracement at 1.34673, sitting on strong horizontal support that has already been tested multiple times on this chart. This is where wave Ⓒ is most likely to finish, based on where the structure meets prior demand.
That overlap between the Fibonacci level and the horizontal zone is exactly the kind of confluence that matters in Elliott Wave counts. One number alone rarely means much. Two independent tools pointing at the same price does.
Why is GBPUSD price action so choppy right now?
Look at the internal labeling on the 4h chart. The move down from wave Ⓑ is unfolding as a corrective sequence with W, X, Y sub-waves and multiple overlapping A-B-C legs. That is not impulsive price action. That is a market working through a correction, and corrections are messy by design.
Traders looking for a clean trend during this phase are fighting the structure. The chop is not noise to filter out, it is the wave itself telling you what phase the market is in.
Could GBPUSD break below the 0.382 Fib?
Yes, and that is worth planning for. Price can test below before turning. A false break into the 0.5 Fib at 1.34085 or even the 0.618 Fib at 1.33497 is possible in a market this choppy.
This does not break the larger bullish count on its own. The invalidation level for the broader structure sits down at 1.31593, well below both of those Fibonacci levels. A dip into the 0.5 or 0.618 zone would still fit inside a valid wave Ⓒ, it would just mean the correction takes a bit longer to finish.
How should traders approach this GBPUSD setup?
The approach here is to wait for the correction to finish and evaluate the trend at the start of the bullish leg. That is where the high RRR setup lives, not inside the chop.
A tight stop below wave Ⓒ, with the target set back toward the highs near wave Ⓐ and the prior wave V high above 1.36500, is the structure this count points to once the reversal confirms. Until then, this is a waiting game.
The correction is not finished, and the level to watch is the 0.382 Fib support with a possible extension toward 0.5 or 0.618. We don't trade the noise. We trade the clean reversal.
Key Takeaways
- •GBPUSD is completing a corrective wave Ⓒ toward the 0.382 Fib retracement at 1.34673.
- •The larger GBPUSD structure remains bullish, with wave V expected once the correction finishes.
- •A false break below 1.34673 toward the 0.5 or 0.618 Fib is possible without invalidating the GBPUSD count.
- •The GBPUSD invalidation level for this bullish structure sits at 1.31593.
- •Traders are watching for a clean reversal signal in GBPUSD rather than trading the current choppy price action.
Frequently Asked Questions
What is the key Fibonacci level for the GBPUSD wave C correction?
The 0.382 Fib retracement at 1.34673 lines up with strong horizontal support, making it the primary zone where wave Ⓒ is expected to complete.
What invalidates the bullish GBPUSD Elliott Wave count?
A break below 1.31593 would invalidate the broader bullish structure that has wave V still developing to the upside.
Why is GBPUSD price action so choppy right now?
The pair is inside a corrective wave Ⓒ with overlapping W-X-Y sub-waves, which naturally produces messy, non-directional price action compared to an impulsive trend.
Disclaimer: This analysis is for educational purposes only and does not constitute financial advice. Elliott Wave analysis involves subjective interpretation. Always do your own research and manage your risk accordingly.
Get Full Coverage for All 27 Instruments
Premium members receive daily wave counts with entry zones, targets and invalidation levels, published daily across all 27 instruments.
View Premium Plans