USDJPY Elliott Wave: 160.50 Top Holds Below 157.93
Two roads. One chart.
Two roads. One chart.
Road one: you watch the candles. Red, green, red, green. You feel excited. You feel scared. You react.
Road two: you watch the waves. You see where the move started. You see where it ends. You wait.
Same chart. Different mind.
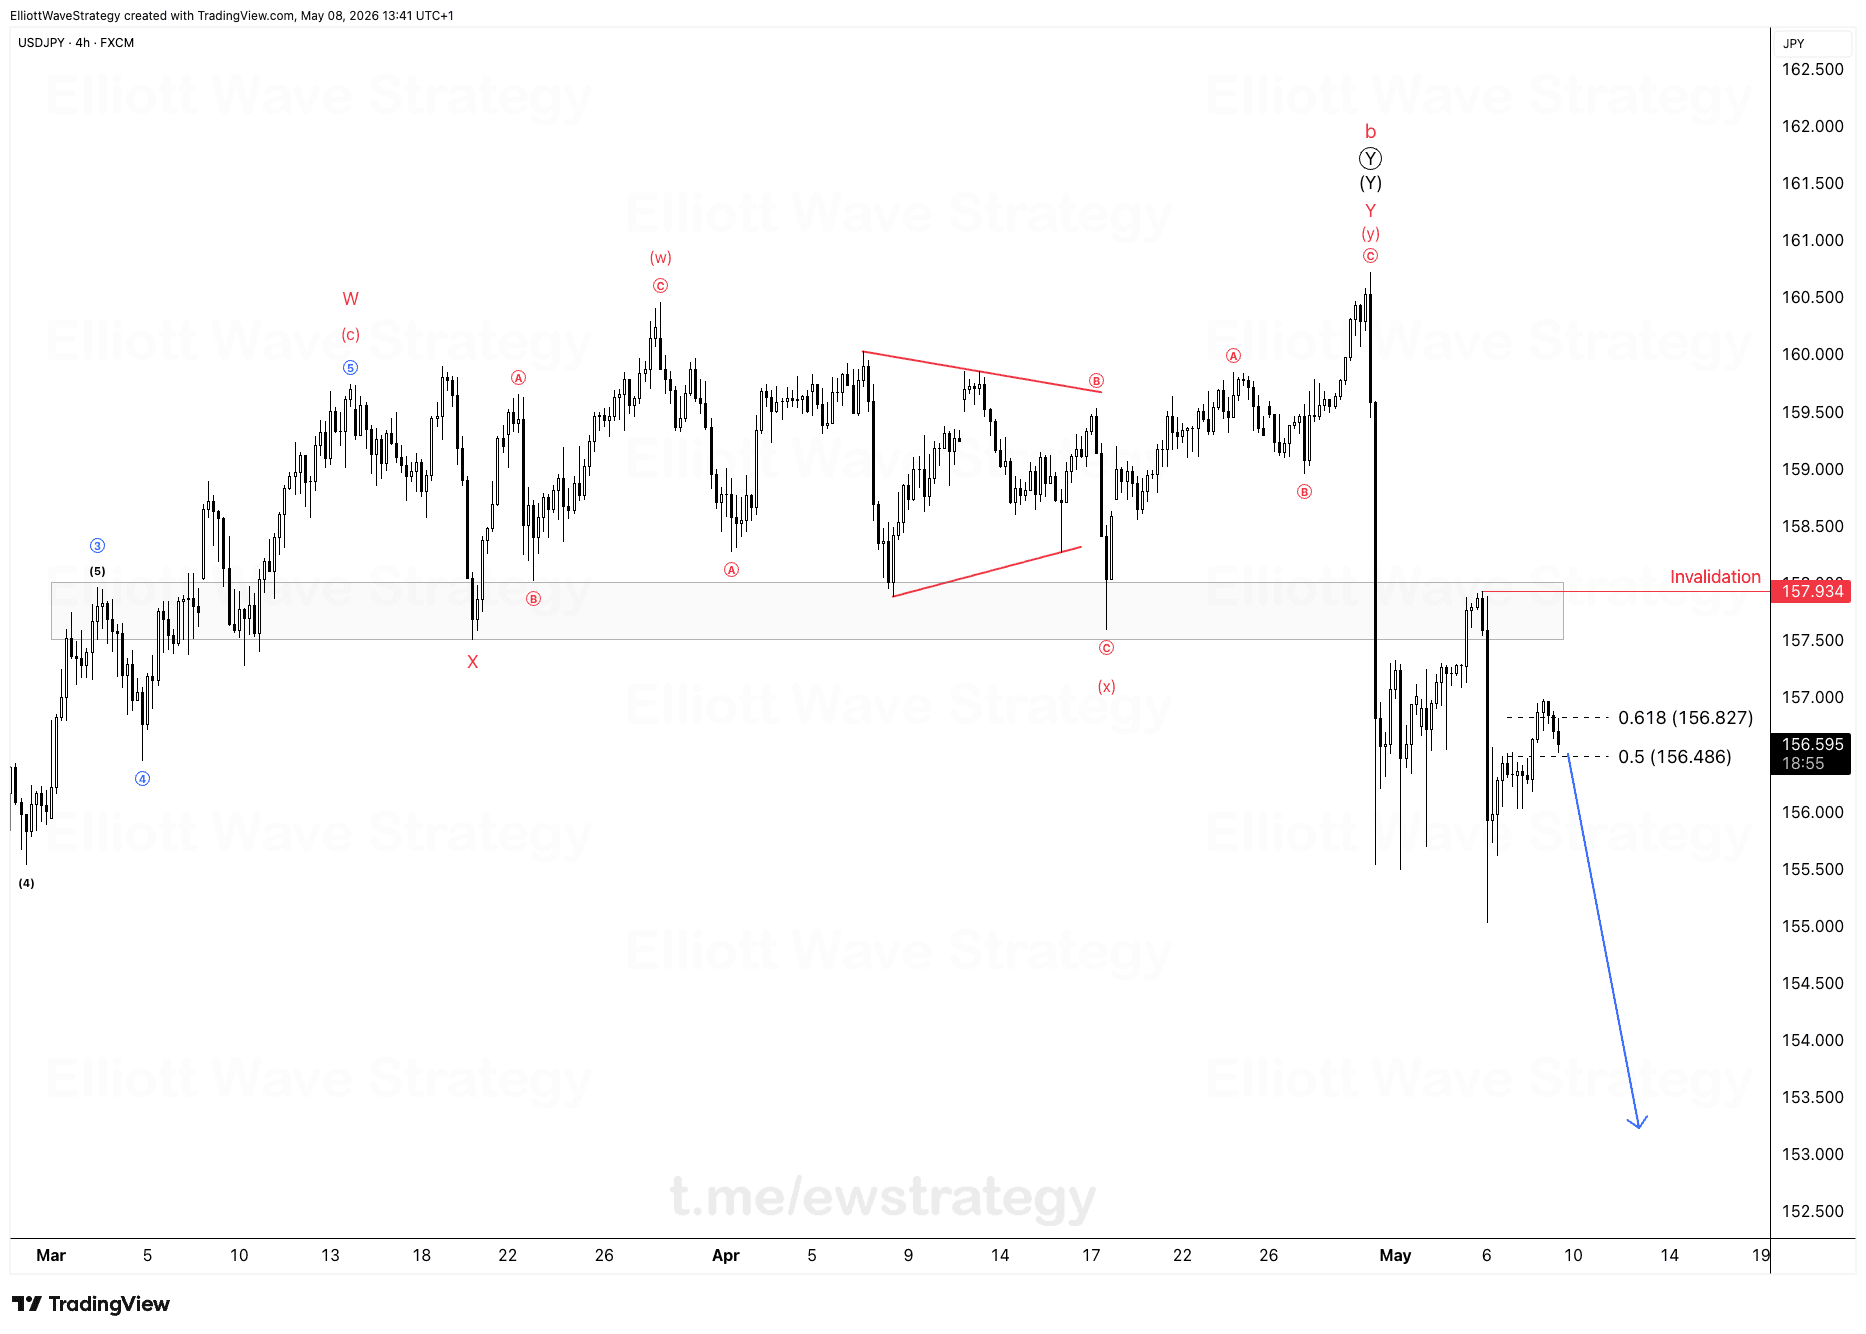
USDJPY tapped 160.50 and turned. That level lines up with wave b of (Y), the final piece of a larger double correction labeled W-X-Y. The invalidation sits at 157.93. Below it, the bearish count stays alive. The next leg is loading.
What does the USDJPY chart actually show
Go back to March. Wave (5) of an earlier impulse tops out, then price drops into a W-X-Y correction. Wave W forms first, wave X pulls back, and wave Y builds as its own zigzag: (w), a contracting triangle for (x), then (y) pushing up into the b-wave top near 160.50.
That triangle inside wave (x) matters. Triangles show up in fourth waves and in b-waves, they chop sideways while the market decides its next real direction. Once it broke to the downside and completed the (y) leg into 160.50, the whole Y-wave was done.
From there, price dropped hard. The reaction low near 155 and the current retracement toward the 0.5 and 0.618 Fibonacci levels (156.486 and 156.827) is exactly what you would expect after a sharp impulsive decline. Corrections retrace into these zones before the trend resumes.
Why the invalidation at 157.93 matters more than any single candle
Most traders live in the first world. They see a red candle and panic. They see a green candle and chase. Every move feels like news.
Elliott Wave traders live in the second world. They see a five-wave impulse complete and step back. They watch a three-wave correction unfold and prepare. Every move was already mapped.
157.93 is not a guess. It is the line that separates a bounce from a structure break. As long as USDJPY holds under it, the bearish count from the 160.50 top remains intact. A close above it would force a rethink, not a panic.
What comes next if the structure holds
The drawn projection on the chart points toward the 153 area, extending the decline that started at 160.50. That is the next leg the wave count is loading for, provided price respects the 156.486 to 156.827 retracement zone and turns back down without breaching 157.93.
The difference between the two roads is not intelligence. It is perspective. When you trade waves instead of candles, you stop reacting to every price tick. You start positioning for the entire move.
Reactive traders are still asking what happened to USDJPY today. Wave traders already know what the structure says comes next.
Key Takeaways
- •USDJPY topped near 160.50 in what the wave count labels as wave b of (Y), completing a larger W-X-Y correction.
- •The invalidation level for the bearish USDJPY count is 157.93, and a hold below it keeps the next leg down active.
- •USDJPY is retracing into the 0.5 and 0.618 Fibonacci levels at 156.486 and 156.827 after the sharp drop from 160.50.
- •A contracting triangle inside wave (x) preceded the final push into the 160.50 top, a common signature ahead of trend resumption.
- •The current projection on the USDJPY chart points toward the 153 region if the structure below 157.93 stays intact.
Frequently Asked Questions
What invalidates the bearish USDJPY Elliott Wave count?
A move back above 157.93 would break the current bearish structure and invalidate the count that expects further downside toward 153.
Why did USDJPY reverse at 160.50?
The 160.50 area marks the completion of wave b of (Y), the final leg of a larger W-X-Y correction, which is why the reversal happened there rather than at a random price.
What do the Fibonacci levels at 156.486 and 156.827 mean for USDJPY?
These are the 0.5 and 0.618 retracement levels of the decline from 160.50, and price reacting near them fits the expectation of a corrective bounce before the next leg lower.
Disclaimer: This analysis is for educational purposes only and does not constitute financial advice. Elliott Wave analysis involves subjective interpretation. Always do your own research and manage your risk accordingly.
Get Full Coverage for All 27 Instruments
Premium members receive daily wave counts with entry zones, targets and invalidation levels, published daily across all 27 instruments.
View Premium Plans