USOIL Elliott Wave: Triangle Breaks, Wave 2 Bounce Ahead
The triangle did what triangles do. It coiled, compressed, and broke.
The triangle did what triangles do. It coiled, compressed, and broke.
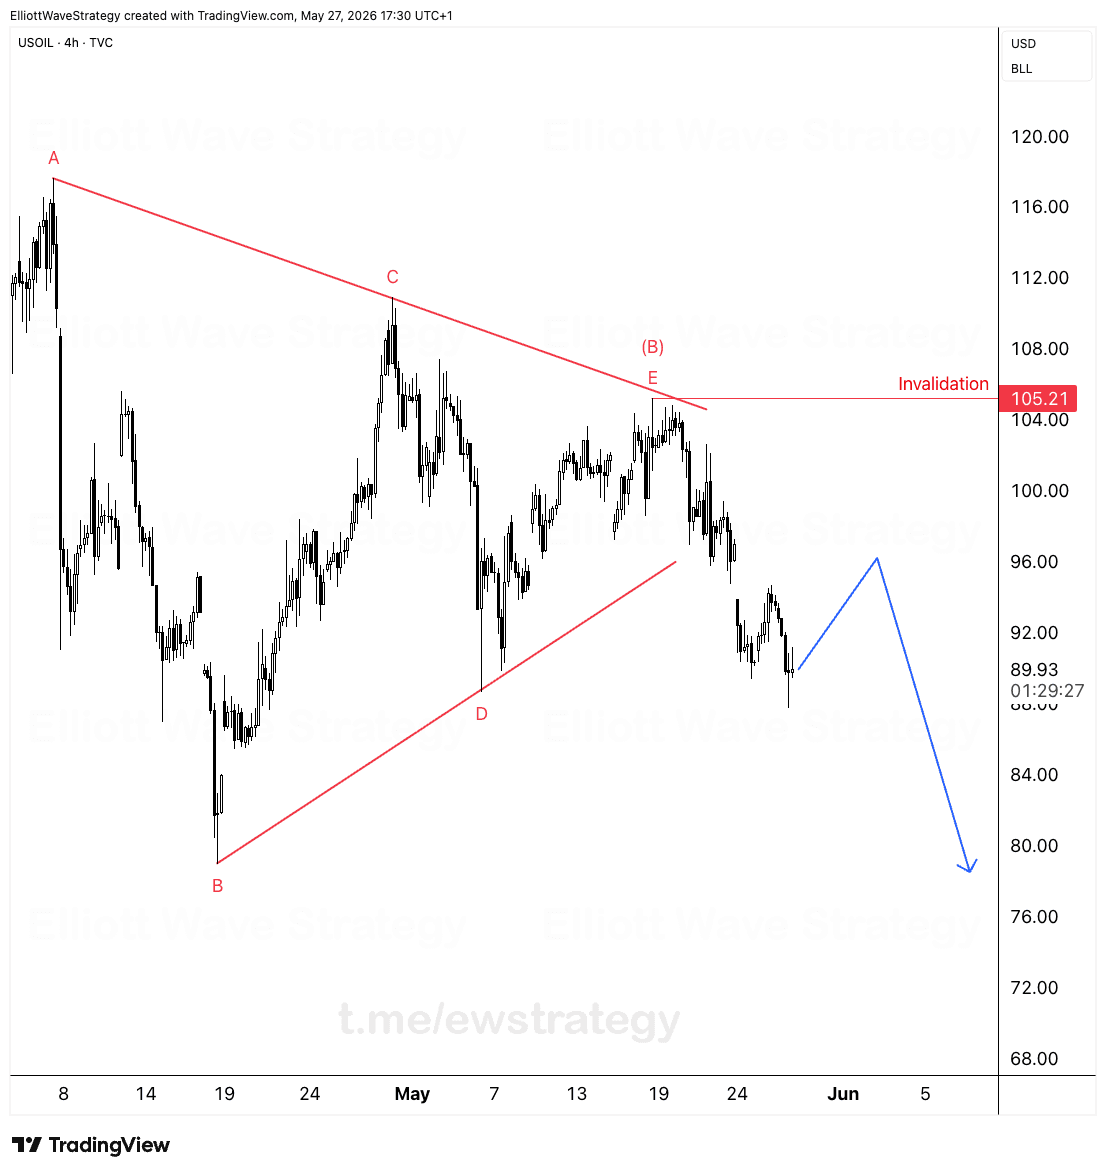
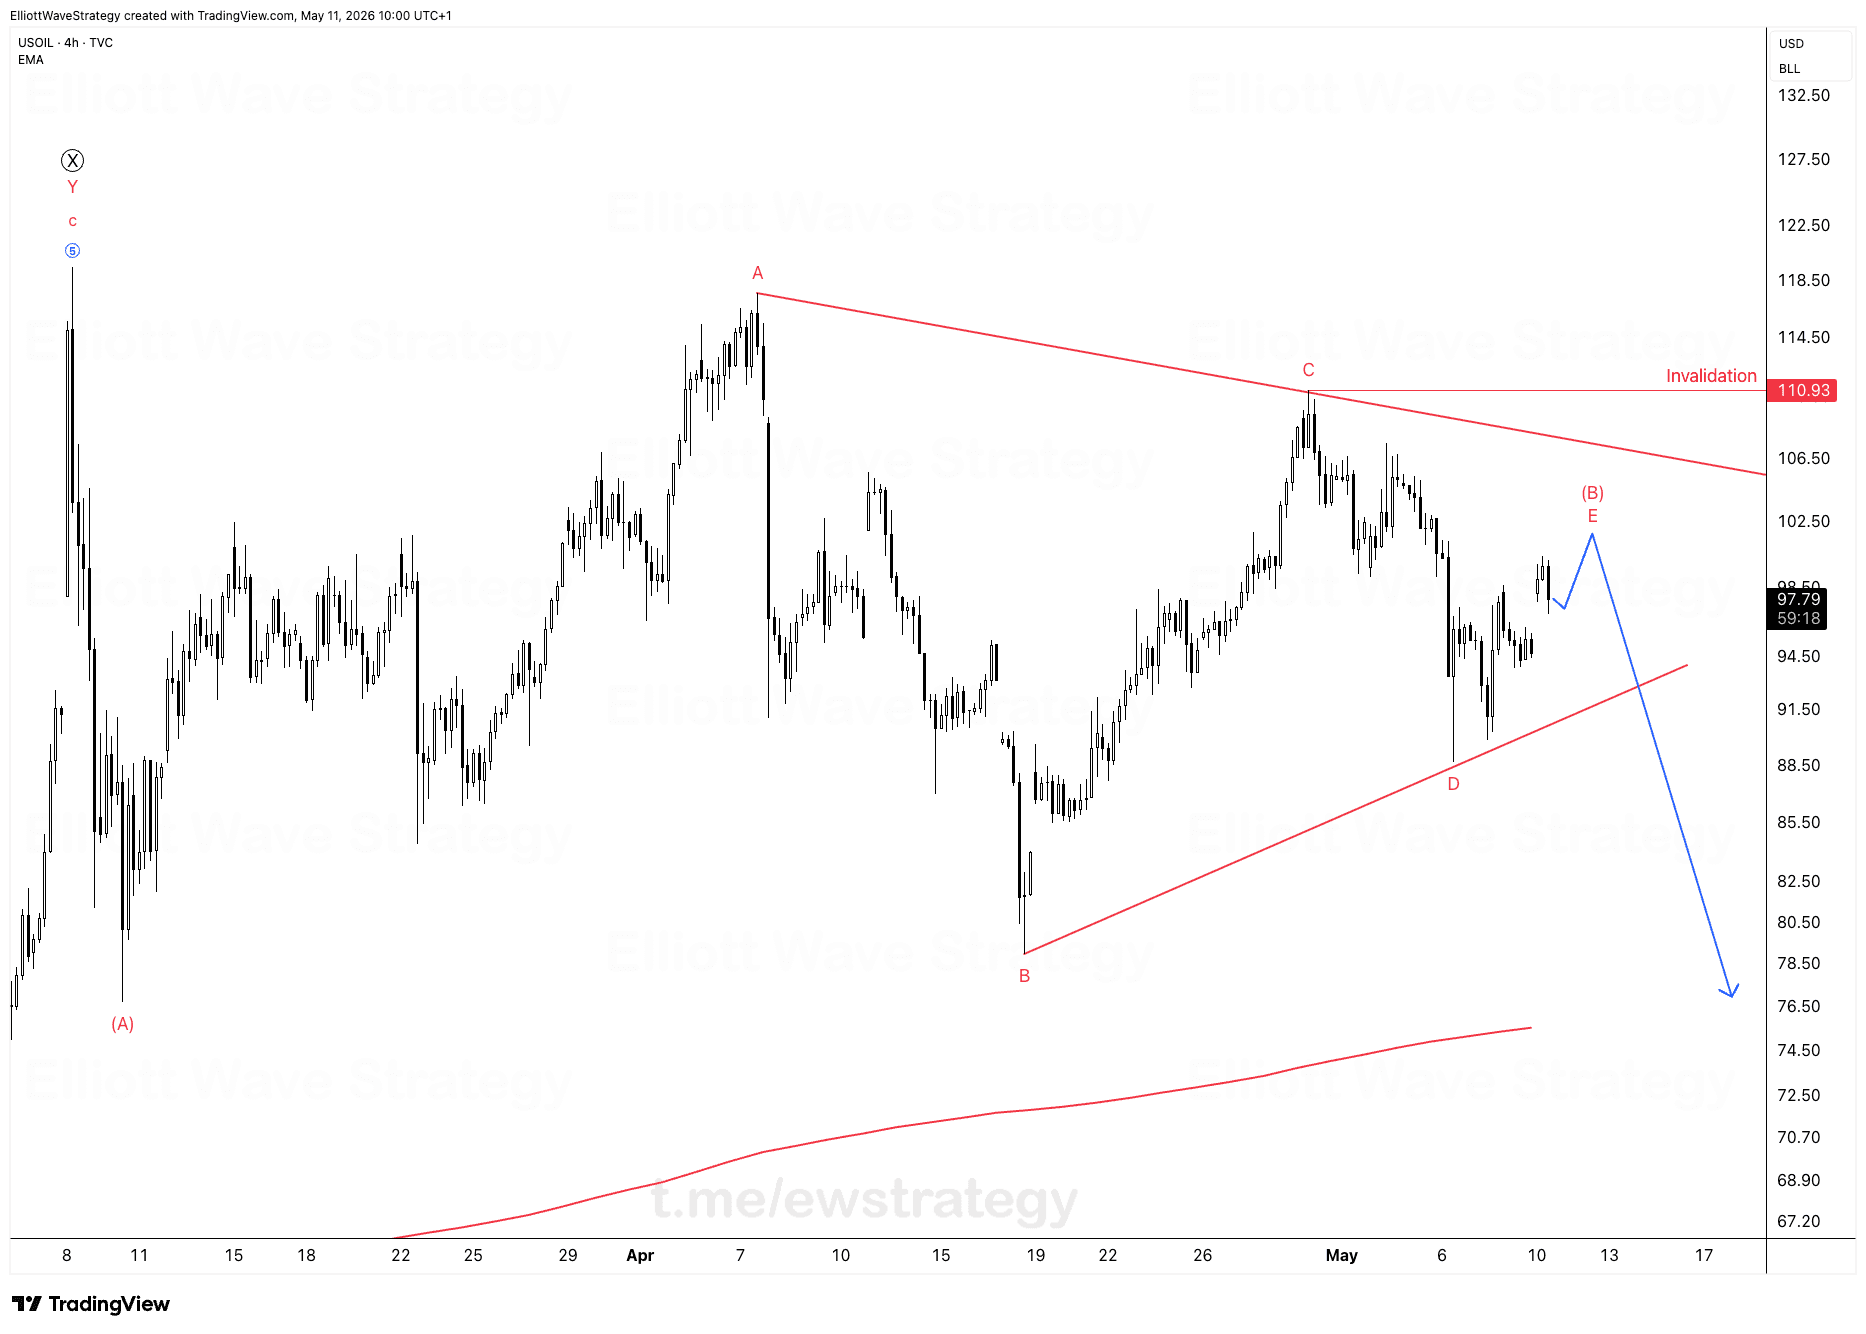
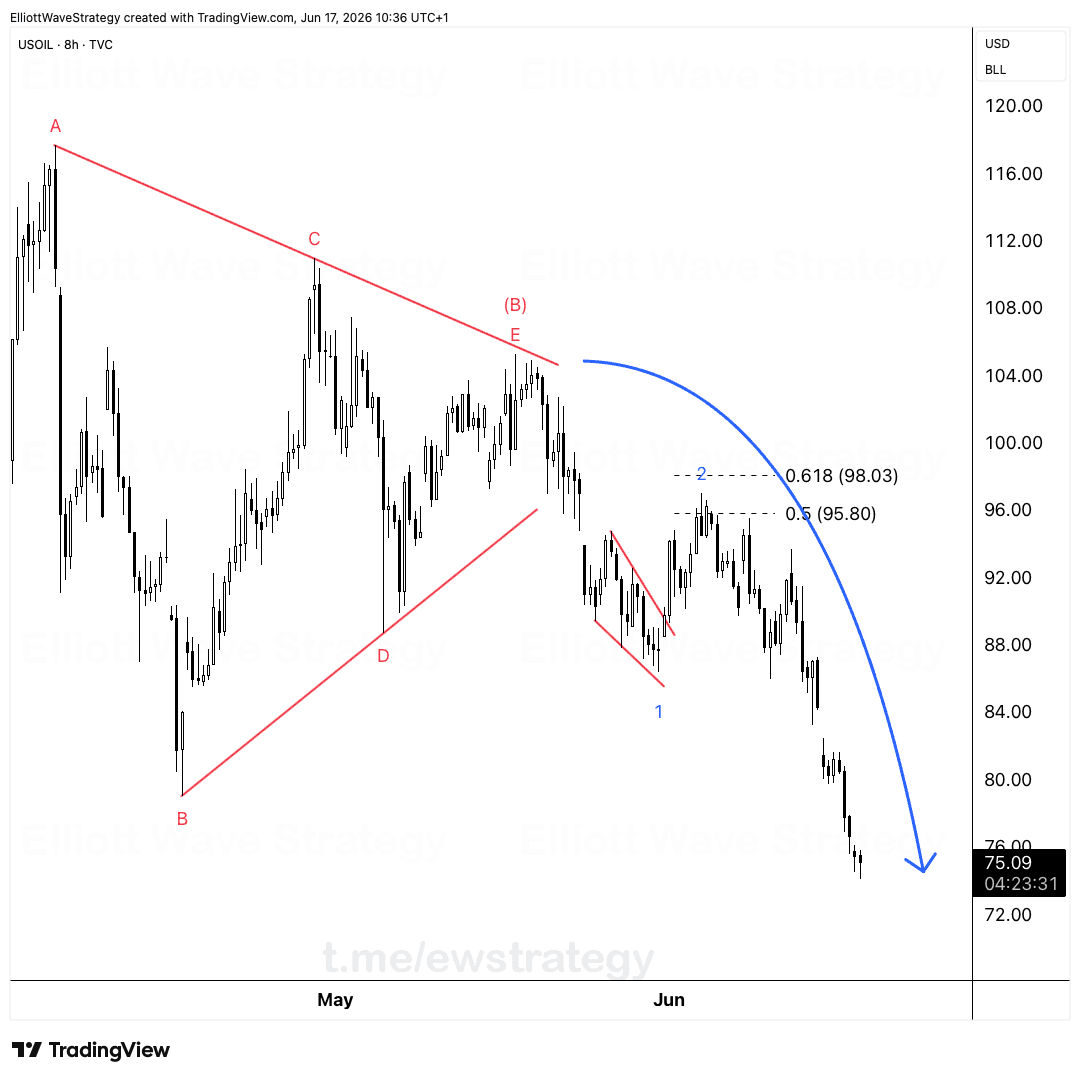
We mapped this structure days ago on USOIL. The A-B-C-D-E triangle completed at the E wave, right at the descending trendline connecting A and C. That was the signal, not a guess. Wave 1 down has already printed, dropping from the E wave high into the low $88 region.
Now price is bouncing. That bounce is Wave 2, and it is doing exactly what Wave 2s are built to do: correct just enough to convince latecomers the drop is over.
What does the triangle completion actually mean for USOIL?
A contracting triangle with legs A, B, C, D, E is a corrective pattern, and corrective patterns end. When E touched the descending trendline drawn from A through C, the triangle finished its job. That completion point marked the ceiling for the correction and the launchpad for the next impulsive leg down.
Triangles typically appear in the wave 4 or wave B position, and once they resolve, the move that follows is usually sharp and directional. The break below the triangle's lower boundary into Wave 1 confirms the structure did exactly what it was supposed to do.
Why is the current bounce not a reversal?
Wave 1 down has completed, and price is now retracing into the 0.5 to 0.618 Fibonacci retracement zone, between $95.80 and $98.03. This is a textbook Wave 2 correction, not a change in trend.
Wave 2 corrections exist for one reason: to exhaust the impatient and reload the disciplined. Traders who missed the initial Wave 1 decline are being handed a second entry, not a signal that the bearish structure has failed. The market is offering a retest of higher prices before the next impulsive wave takes over.
What happens once Wave 2 exhausts itself?
Once this retracement runs out of steam inside the $95.80-$98.03 zone, Wave 3 takes over. In Elliott Wave structure, Wave 3 is typically the longest and most powerful leg of an impulse, and the drawn trajectory on this chart shows a decline extending well below the prior Wave 1 low, projected toward the mid $70s and beyond.
That move would make the initial thirty dollar drop from the triangle breakdown look like a warmup. The approach here is not to chase the bounce. It is to wait for price to stall in the Fibonacci zone and sell into strength once the stall is confirmed.
Structure over sentiment
Structure is in charge here, not the news, not sentiment. The A-B-C-D-E triangle, the Wave 1 decline, and the current Wave 2 retracement all fit together as one coherent Elliott Wave picture on USOIL. As long as price respects the Fibonacci retracement zone and fails to reclaim the triangle's E wave high, the bearish count holds.
Key Takeaways
- •USOIL completed an A-B-C-D-E contracting triangle at the E wave, right at the descending trendline from A to C.
- •Wave 1 down has printed on USOIL, and the current bounce is being read as a Wave 2 correction, not a trend reversal.
- •The Wave 2 retracement zone on USOIL sits between the 0.5 and 0.618 Fibonacci levels, from $95.80 to $98.03.
- •If Wave 2 stalls in the Fibonacci zone, Wave 3 down is expected to extend well beyond the Wave 1 low.
- •The USOIL bearish count is invalidated if price reclaims the triangle's E wave high with strength.
Frequently Asked Questions
What invalidates the bearish USOIL Elliott Wave count?
A sustained break back above the E wave high of the triangle would undermine the current Wave 1 down and Wave 2 correction count, since a genuine Wave 2 should not fully retrace or exceed the prior triangle high.
Why is the USOIL bounce considered a Wave 2 and not a bottom?
The bounce is retracing into the classic 0.5 to 0.618 Fibonacci zone after an impulsive Wave 1 decline, which is the typical depth and behavior of a corrective Wave 2 rather than a trend reversal.
What comes after Wave 2 completes on USOIL?
According to the Elliott Wave count, Wave 3 follows, and Wave 3 is generally the strongest and longest leg of an impulse, projected to extend the decline significantly below the Wave 1 low.
Disclaimer: This analysis is for educational purposes only and does not constitute financial advice. Elliott Wave analysis involves subjective interpretation. Always do your own research and manage your risk accordingly.
Get Full Coverage for All 27 Instruments
Premium members receive daily wave counts with entry zones, targets and invalidation levels, published daily across all 27 instruments.
View Premium Plans