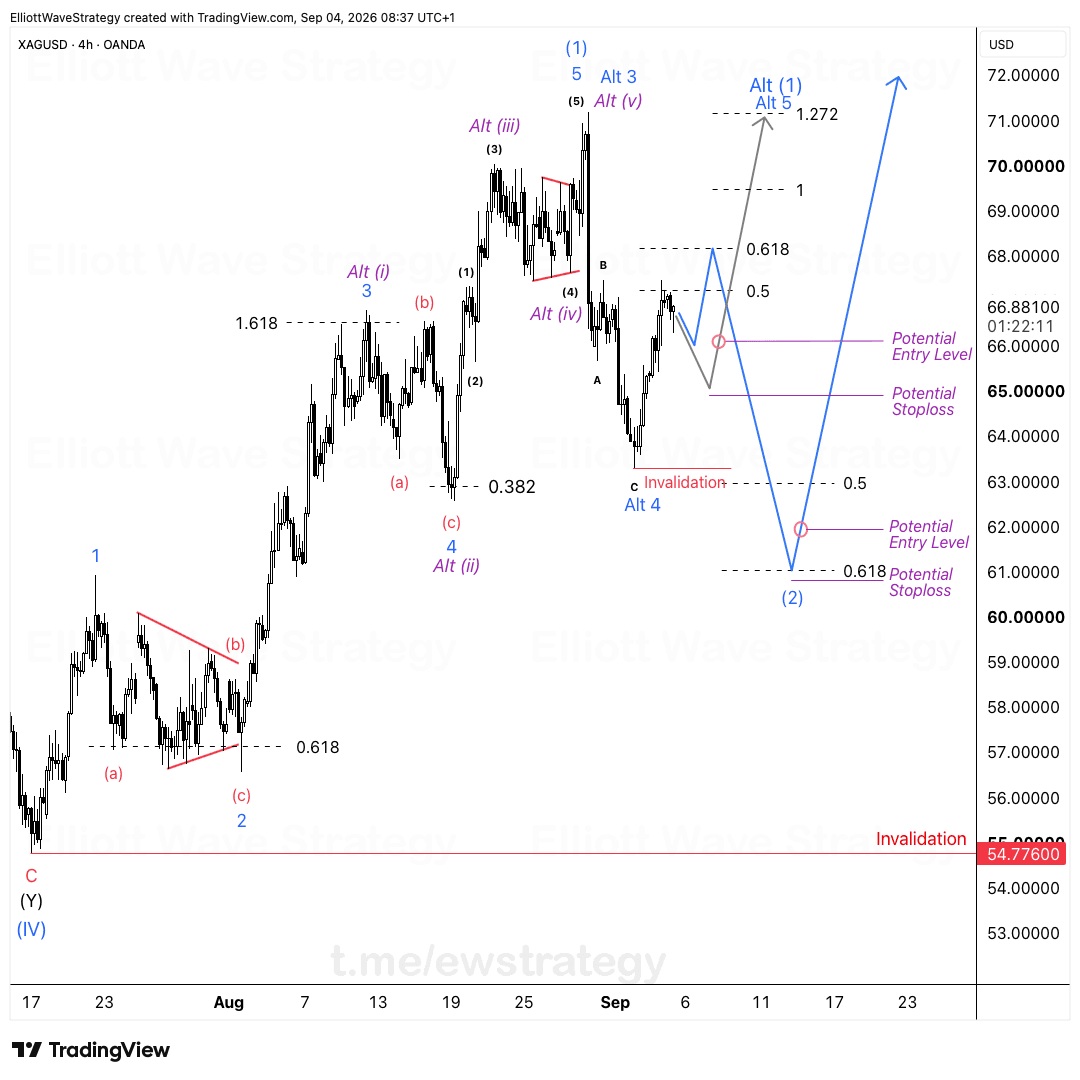
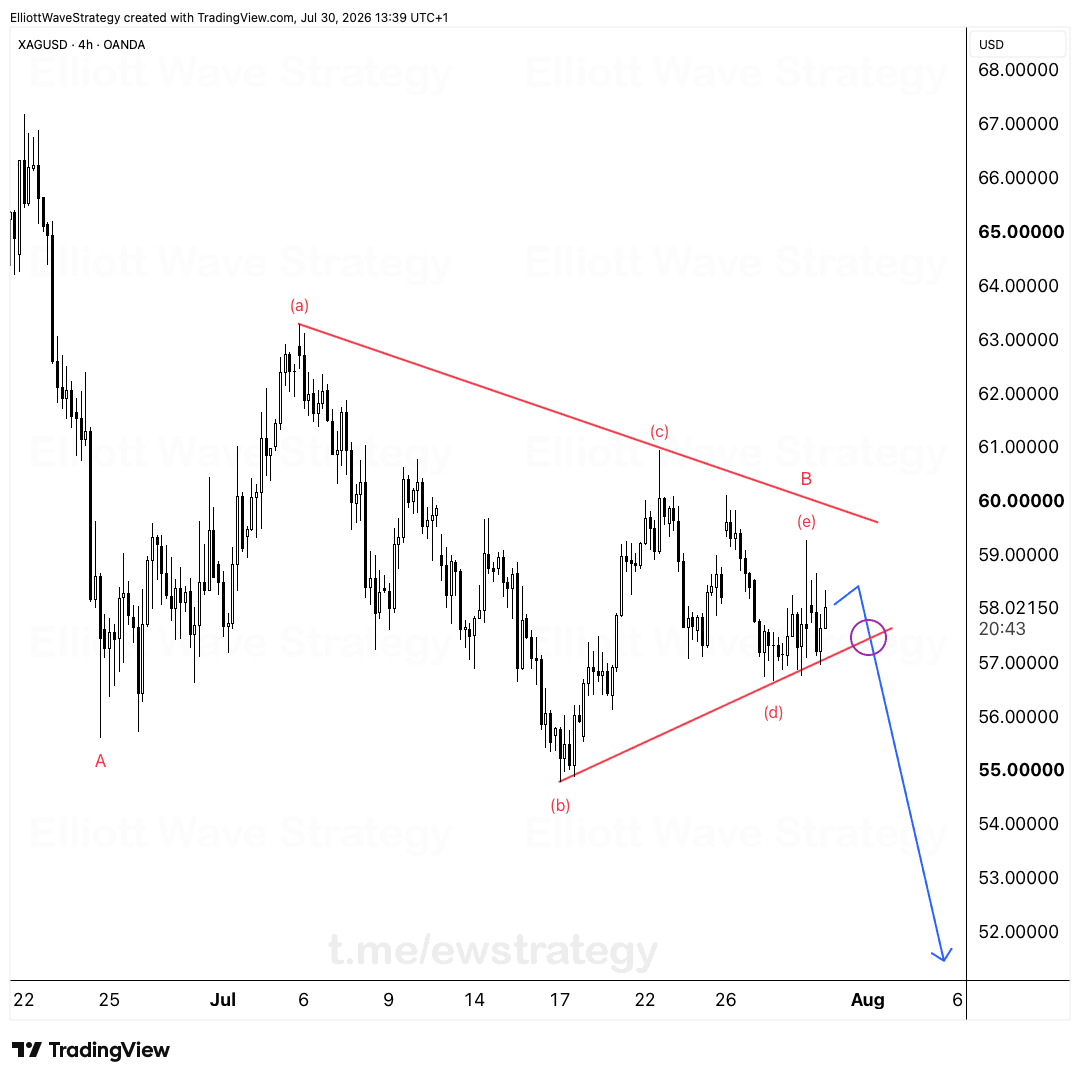
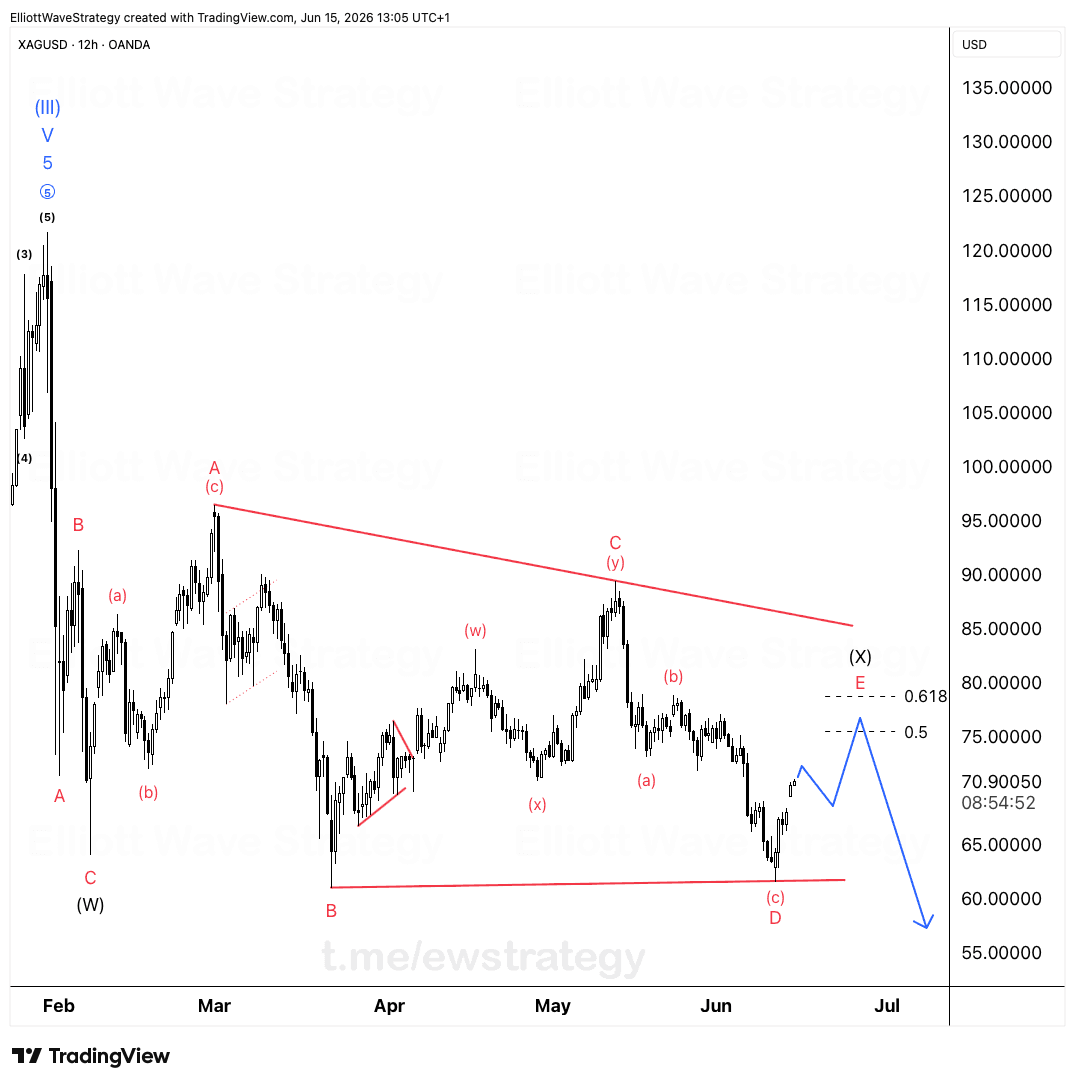
XAGUSD Elliott Wave: Triangle Done, $56 Target Opens
The triangle is done. Silver is rolling over.
Silver just finished doing what silver does before it drops. The triangle is done, and the market is rolling over.
This is exactly the setup patient traders wait for. A contracting triangle takes months to build and gets dismissed as chop by everyone who is not tracking the internal legs. Once it completes, the release move tends to be sharp. That is where XAGUSD sits right now.
What does the triangle completion mean for silver
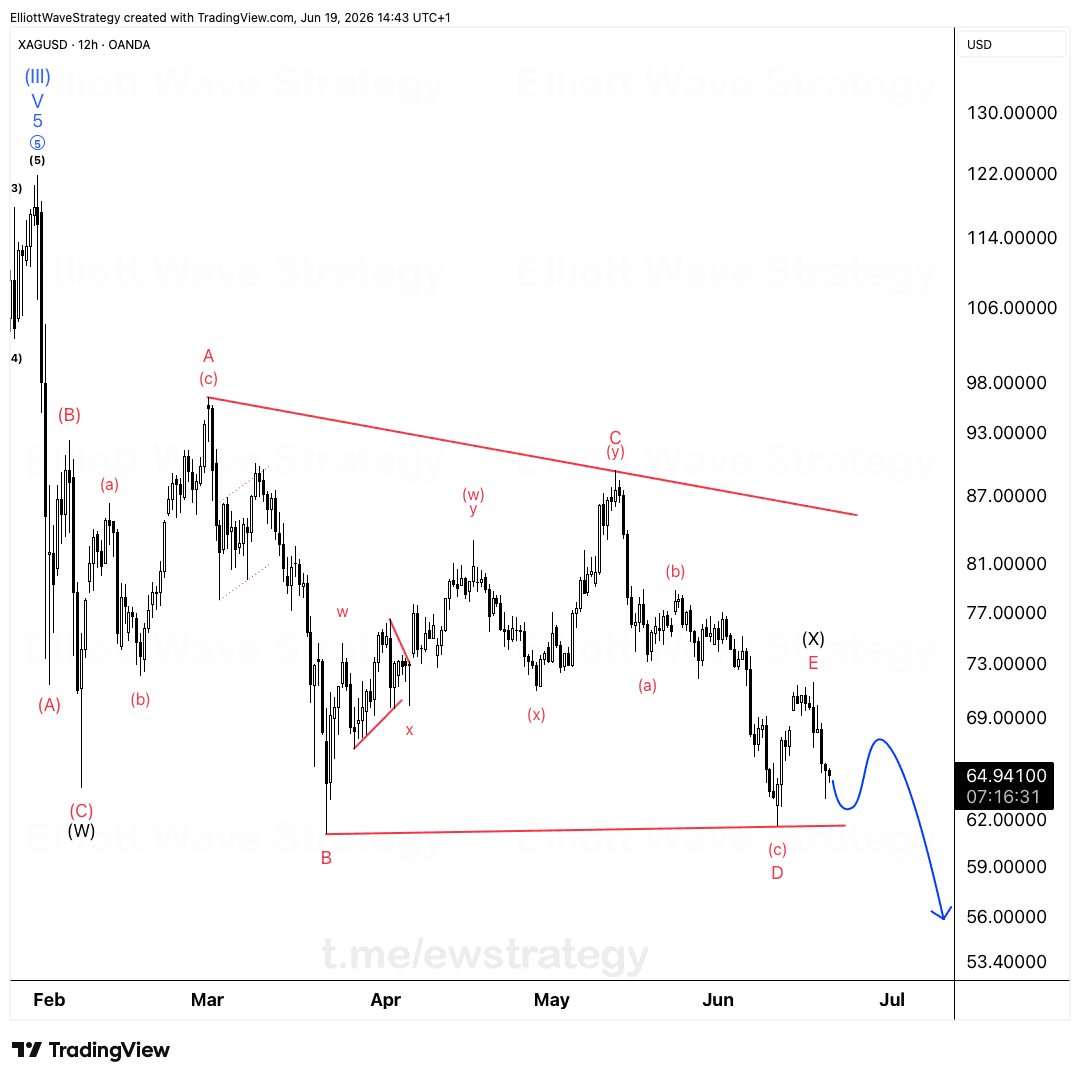
The 12h chart shows a full A-B-C-D-E contracting triangle, with the final E wave topping out near $73. Each leg inside the triangle overlaps the previous one, which is exactly how a triangle is supposed to behave. B, C, D and E all stayed inside the boundary lines drawn on the chart, and E marked the last gasp of the pattern before sellers took over.
Triangles do not resolve sideways. They store energy and then release it in the direction of the prior trend. Since this triangle formed after a bearish impulse, the breakdown out of E lines up with continuation lower, not a reversal.
How did we get here from the Wave (4) top
Zoom out and the bigger picture explains why this matters. Wave (4) of the larger cycle was a complex correction, structured as a WXY. The (y) leg of that correction topped near $88-89 back in June, labeled C/(y) on the chart.
From that top, price broke down hard through the D low of the triangle, then bounced into the E wave near $73 before rolling over again. That sequence, impulsive decline into D, corrective bounce into E, is a textbook triangle finish sitting on top of a much bigger bearish structure. Wave (4) is done. Wave (5) is now underway.
Where is XAGUSD headed next
Price currently sits at $64.94, and sellers are back in control after the E wave failed to hold. The drawn path on the chart projects a shallow bounce first, then a resumption lower into the $56 area.
That $56 zone is where Wave (5) of the larger bearish cycle is targeting. It fits the structure: Wave (4) as a WXY triangle-capped correction, followed by a Wave (5) decline that completes the larger degree move down from the (III) top.
Why the triangle mattered more than the chop looked
Triangles are not noise. They are the market storing energy before the final move, and this one took from March into June to build. Anyone trading the daily swings inside B, C, D and E without seeing the container was fighting the structure the entire time.
Tracking every leg of the pattern, including the overlapping x and y waves inside the WXY correction, is what makes the current breakdown make sense instead of looking random. The market is now confirming what the structure was signaling all along.
Silver's weekly direction reads down, with price at $64.94 and the $56 target sitting below as the next structural objective for Wave (5).
Key Takeaways
- •XAGUSD completed a contracting triangle (A-B-C-D-E) with the final E wave near $73.
- •Silver's Wave (4) correction formed as a complex WXY, topping near $88-89 in June before breaking down.
- •XAGUSD currently trades at $64.94 with sellers back in control after the triangle breakdown.
- •The Elliott Wave structure on XAGUSD projects a decline toward $56 as Wave (5) develops.
- •Triangles in silver's structure represent energy storage before a directional release, not sideways noise.
Frequently Asked Questions
What does the completed triangle mean for XAGUSD's direction?
The A-B-C-D-E triangle completing near $73 signals that Wave (4) is finished and Wave (5) is now developing to the downside, based on the 12h Elliott Wave count.
What is the price target for silver after the triangle breakdown?
The projected path points toward $56, which lines up with the completion zone for Wave (5) of the larger bearish cycle.
What would invalidate the bearish silver count?
A sustained move back above the E wave high near $73 would undermine the triangle completion thesis and call the Wave (5) decline into question.
Disclaimer: This analysis is for educational purposes only and does not constitute financial advice. Elliott Wave analysis involves subjective interpretation. Always do your own research and manage your risk accordingly.
Get Full Coverage for All 27 Instruments
Premium members receive daily wave counts with entry zones, targets and invalidation levels, published daily across all 27 instruments.
View Premium Plans