Gold Elliott Wave: Wave 3 Selloff Mapped Weeks Ahead
One month ago, we shared this exact scenario with Premium members. The complex correction, the invalidation level, the target zone, everything playing out as planned.
Gold just dropped hard, and if you were watching the right roadmap, you saw it coming a month ago.
On February 18th, before wave B of this correction had even printed, this exact sequence was mapped out for Premium members. The complex correction, the invalidation level, the target zone below. Everything on this chart right now was planned weeks in advance, not reacted to.
That's the difference between real Elliott Wave analysis and guessing candle by candle. We don't chase gold's price. The count tells us where price is supposed to go, and then we watch it get there.
What does the XAUUSD chart actually show right now
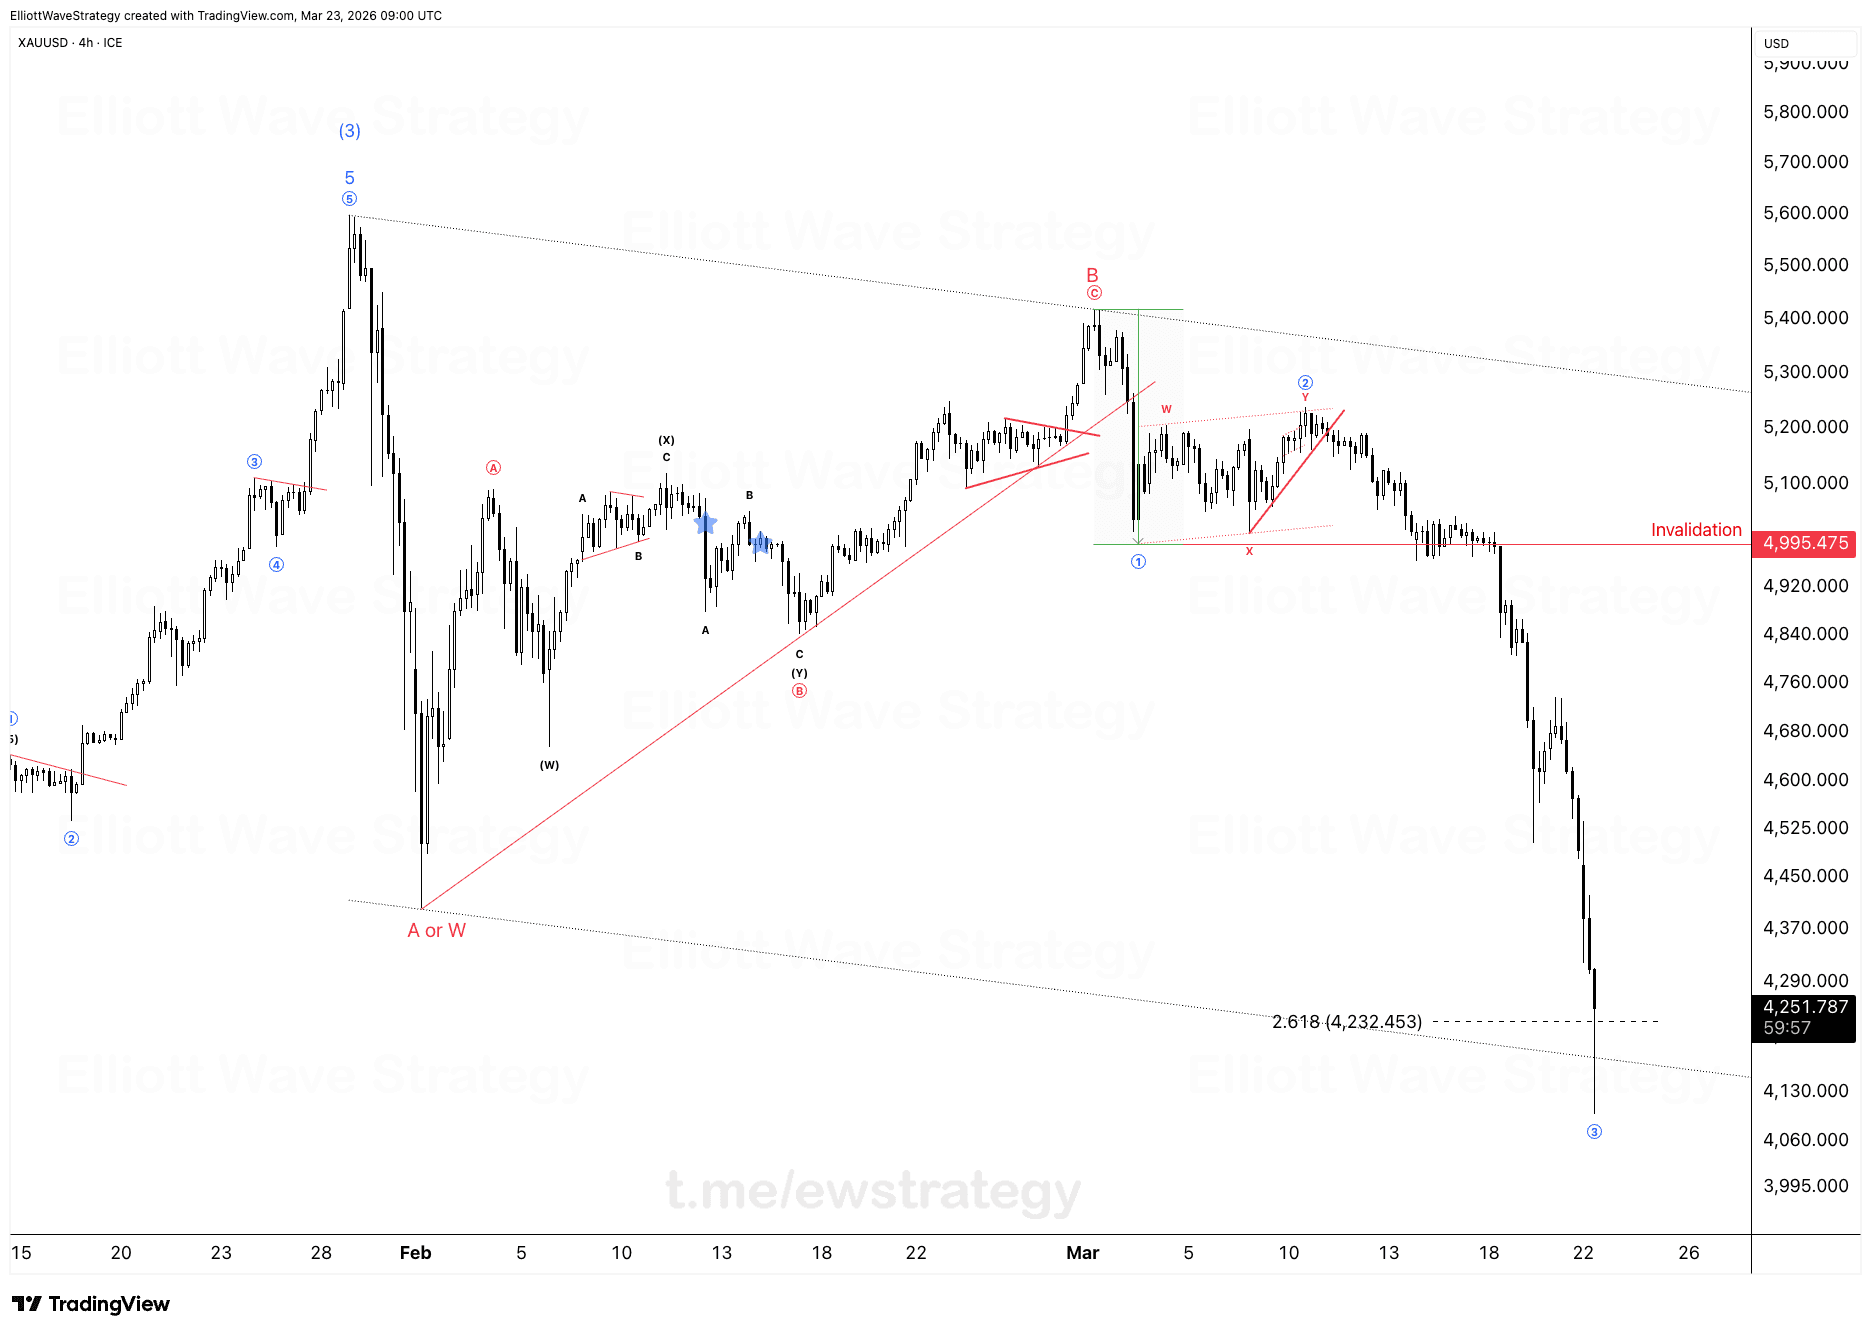
The bigger structure starts with a five wave impulse up into wave ⑤ near 5,600, followed by a corrective sequence labeled Ⓐ, Ⓑ, Ⓒ. Inside that Ⓑ wave sits a WXY double correction: wave (W) down, a triangle-shaped (X), and wave (Y) completing near 5,400 as a zigzag with its own A-B-C internal structure.
From there, price rolled into wave ① down, then built a corrective wave ② that is itself a WXY combination, complete with an internal contracting triangle in the X wave. That wave ② topped out and rejected right around the 5,200 to 5,300 zone before rolling over.
Wave ③ is now the impulse driving gold sharply lower, already tagging 4,251 on the chart with a 2:618 Fibonacci extension target sitting at 4,232.453. The invalidation level for this bearish wave ③ count is marked at 4,995.475. As long as price stays under that line, the downward wave 3 structure stays intact.
Why does mapping wave B in advance matter
A wave B, especially inside a WXY combination, is where most traders get faked out. It looks like a resumption of the uptrend, sucks in fresh buyers, and then reverses hard once the corrective structure completes.
Having the wave ① through wave ② roadmap drawn out before wave B even finished forming meant the eventual rejection near 5,200 to 5,300 and the invalidation line at 4,995.475 were already known values, not levels drawn after the fact. That's the whole point of counting waves properly instead of reacting to headlines or single candles.
What happens if gold breaks the invalidation level
If XAUUSD reclaims and holds above 4,995.475, the wave ③ impulse count down is invalidated. That would force a reassessment of the entire bearish structure and open the door to an alternate wave count.
Until that happens, the chart continues to treat the move down from wave ② as an active wave ③ impulse, with the 2.618 extension at 4,232.453 as the technical target zone drawn directly from the Fibonacci projection on the chart.
Not every count plays out to the pip, and no analysis promises a guaranteed outcome. But when the structure is mapped weeks ahead, including the invalidation level and the target zone, you're trading with a plan instead of reacting to every wick.
The crowd panics at every red candle. A properly built Elliott Wave count on XAUUSD tells you in advance which candles actually matter.
Key Takeaways
- •XAUUSD's wave ③ decline was mapped out on February 18th, before wave B of the prior correction even completed.
- •The wave ② correction on XAUUSD formed as a WXY combination with an internal contracting triangle before rejecting near 5,200 to 5,300.
- •XAUUSD's bearish wave ③ invalidation level sits at 4,995.475, above which the current impulse count would be voided.
- •The 2.618 Fibonacci extension target for XAUUSD's wave ③ is 4,232.453, with price already trading near 4,251.
- •Mapping the wave B and wave ② structure in advance is what separates planned Elliott Wave counts from reactive trading.
Frequently Asked Questions
What invalidates the bearish XAUUSD wave 3 count?
A sustained move back above 4,995.475 would invalidate the current wave ③ impulse count on XAUUSD and require the structure to be reassessed.
What is the Fibonacci target for gold's current wave 3 decline?
The chart projects a 2.618 Fibonacci extension target at 4,232.453, with price already trading close to that zone near 4,251.
Why did wave 2 on XAUUSD look like a triangle?
Wave ② unfolded as a WXY combination correction, and the X wave within it formed a contracting triangle, which is a common structure inside complex corrections.
Disclaimer: This analysis is for educational purposes only and does not constitute financial advice. Elliott Wave analysis involves subjective interpretation. Always do your own research and manage your risk accordingly.
Get Full Coverage for All 27 Instruments
Premium members receive daily wave counts with entry zones, targets and invalidation levels, published daily across all 27 instruments.
View Premium Plans