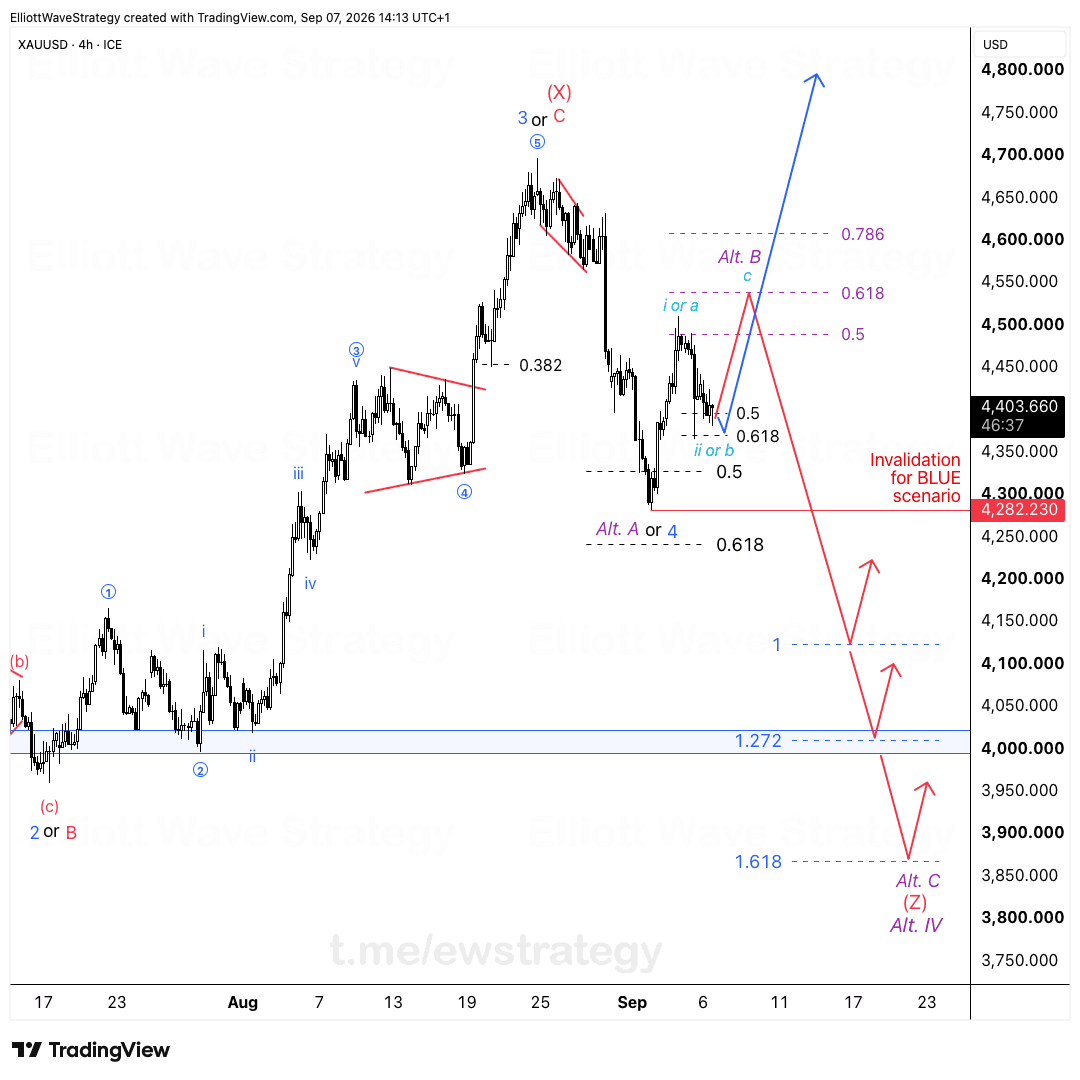
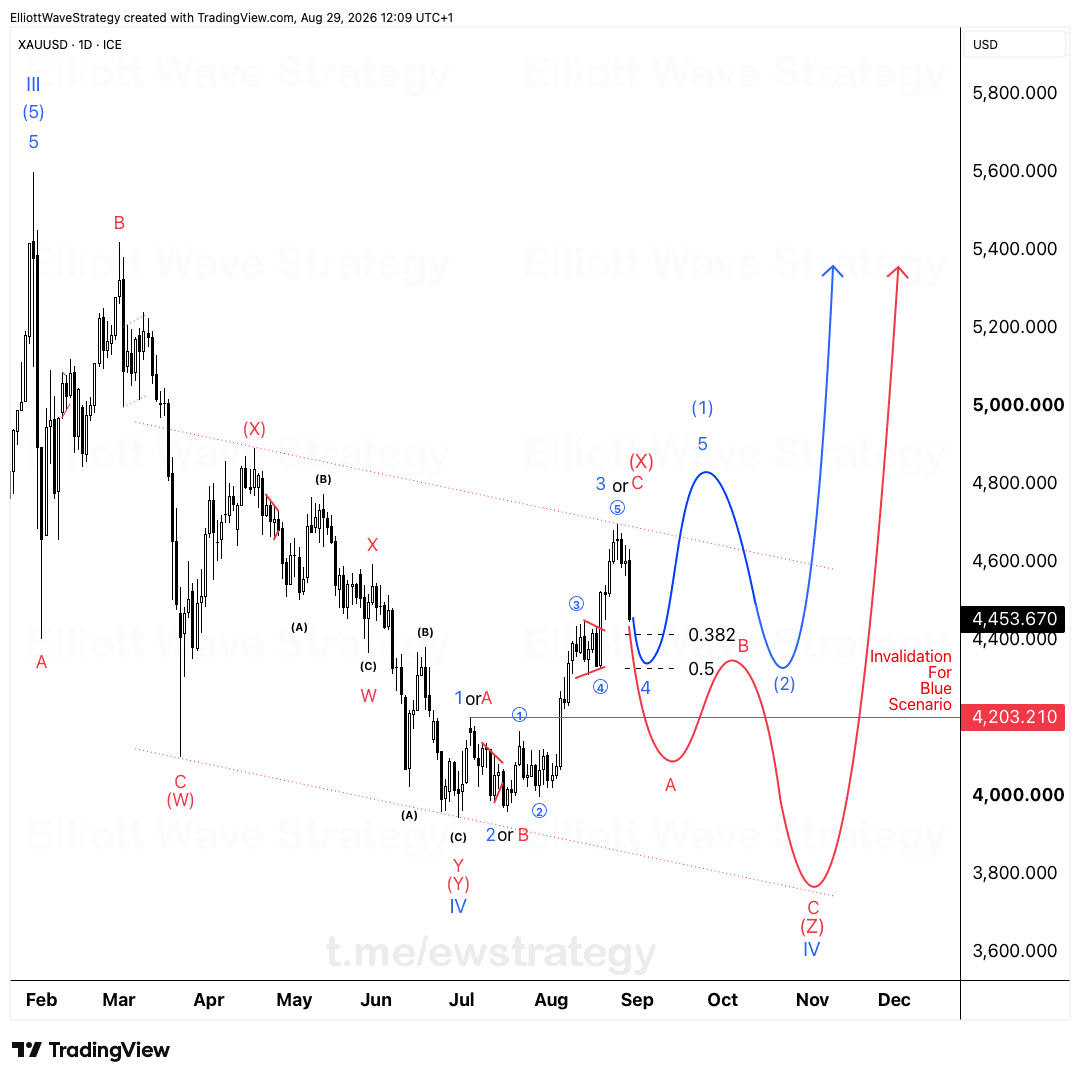
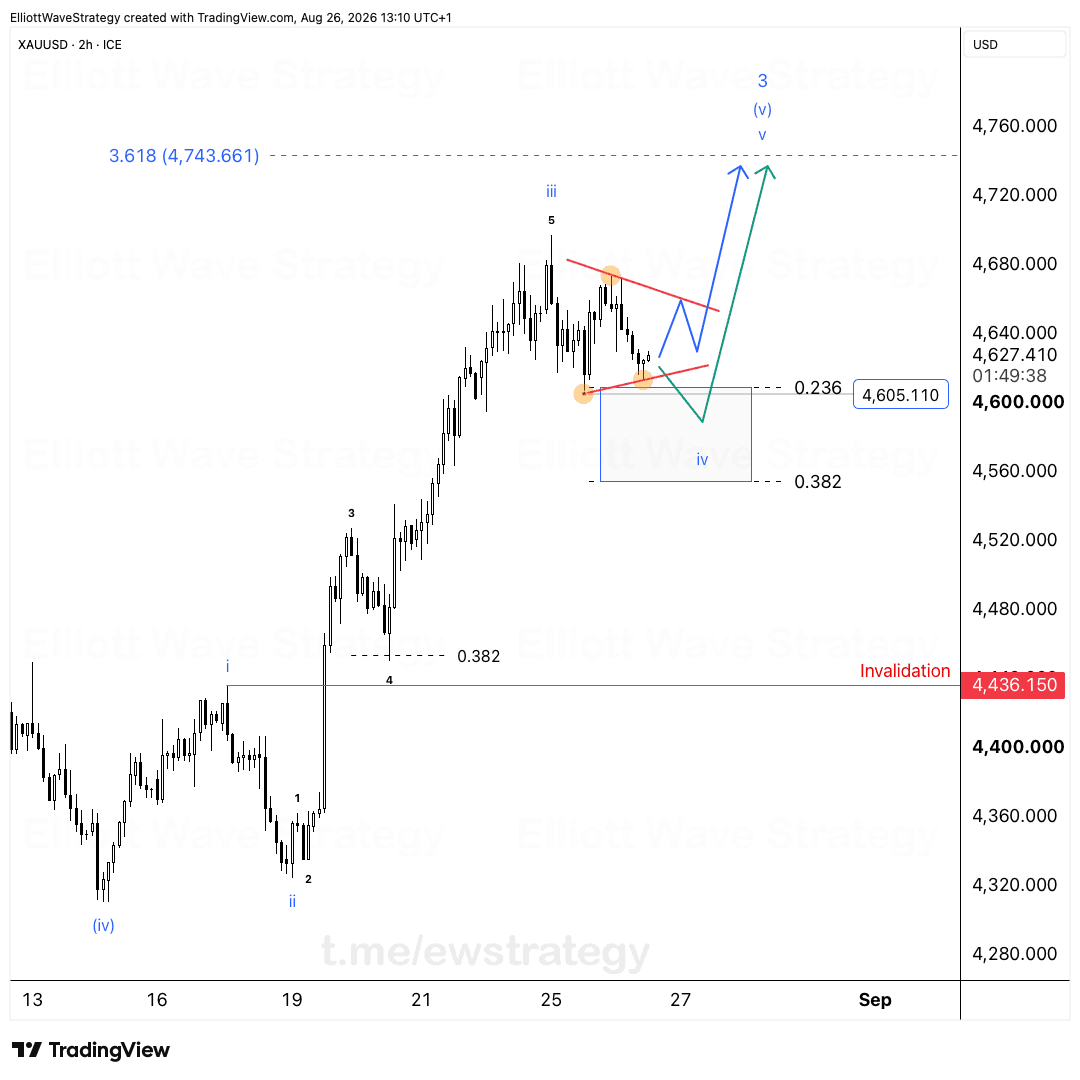
XAUUSD Elliott Wave: Wave (4) Rejected at 0.618 Fib
We called it perfectly.
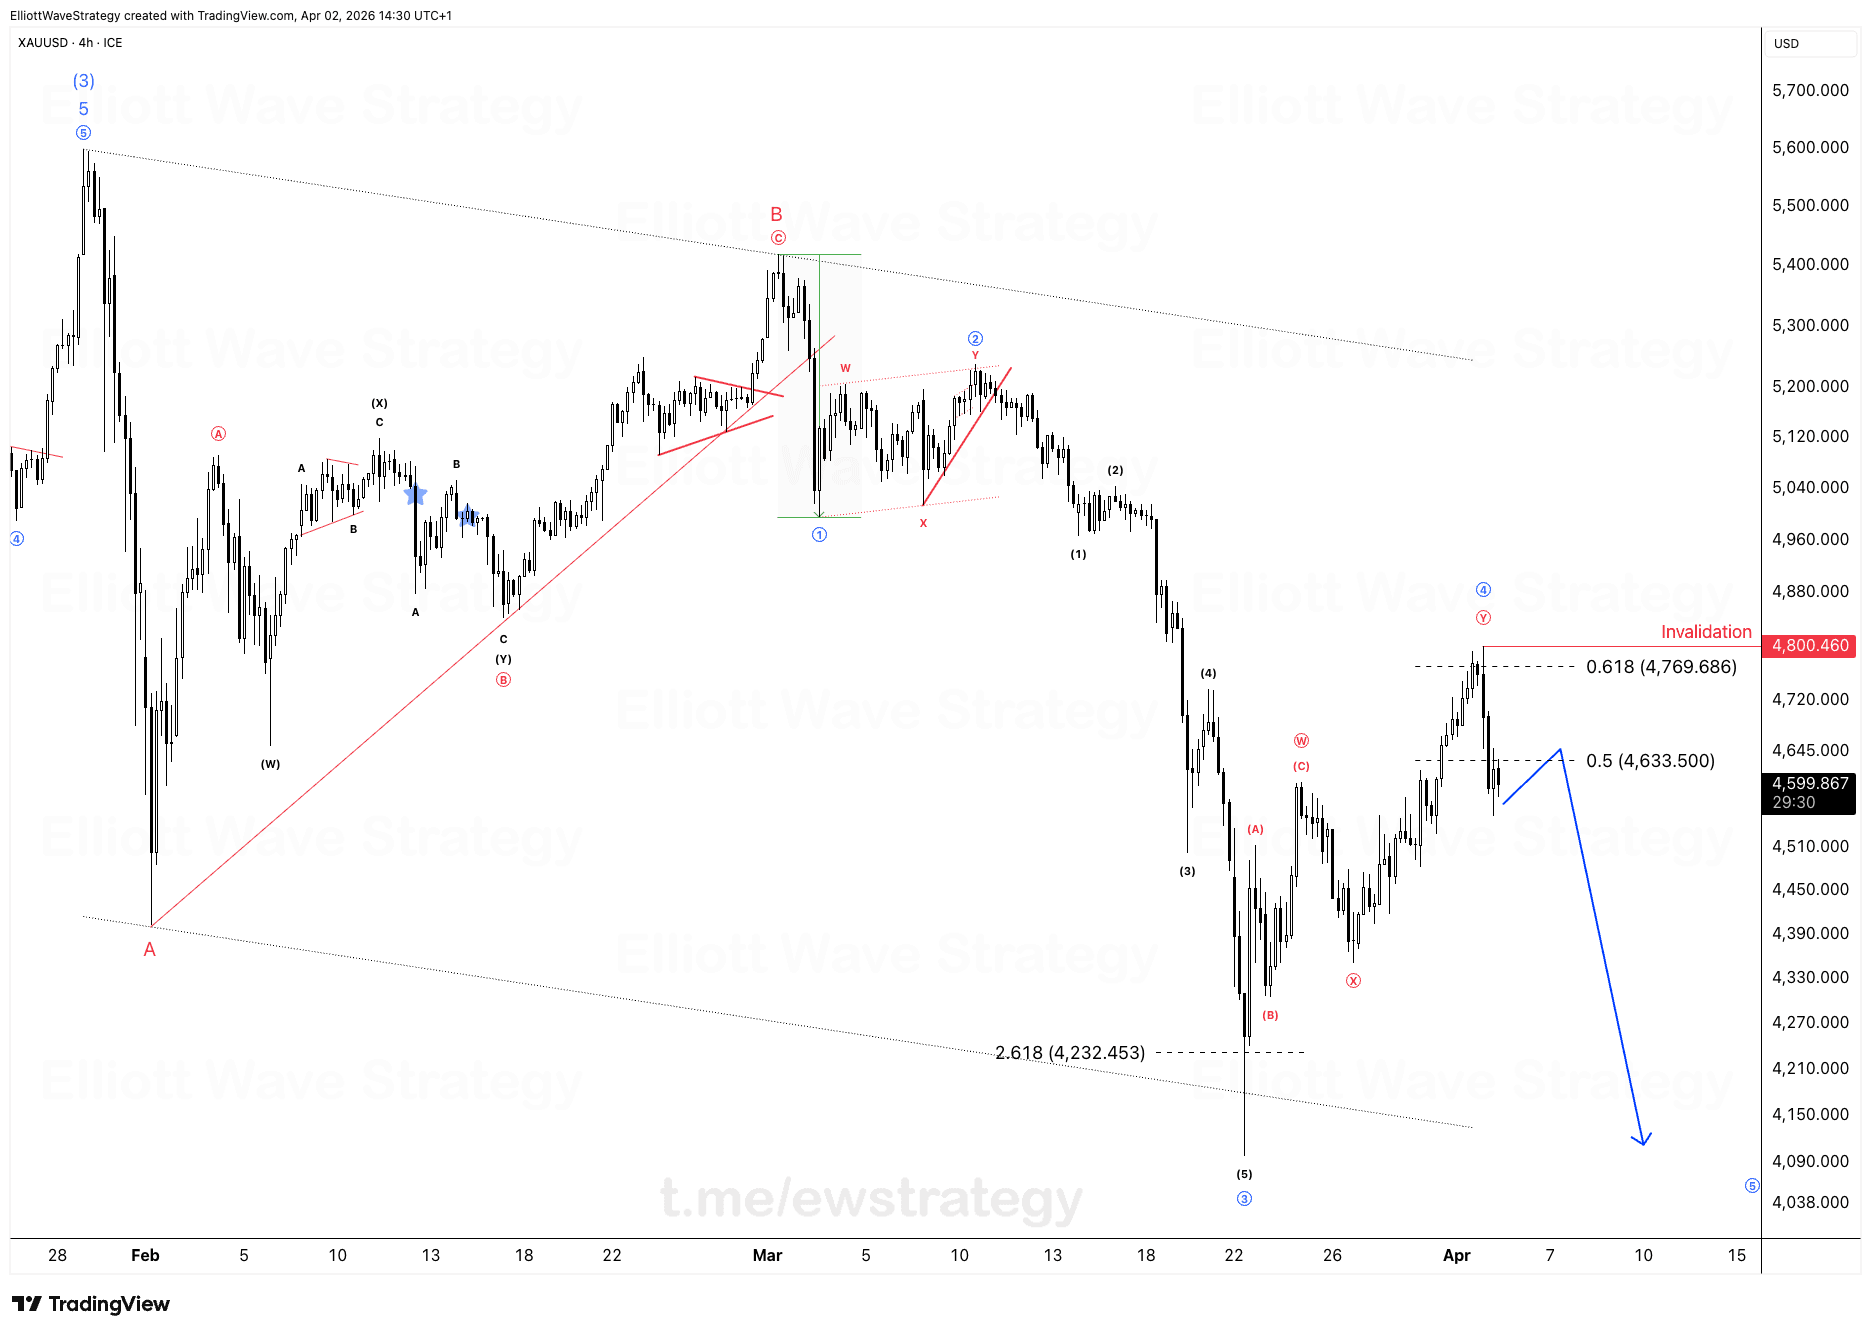
Gold hit the 4750-4800 zone and reversed hard. That was not luck. That was Wave (4) doing exactly what the count said it would do.
The prior call was simple. Wave (4) was correcting higher toward the 0.618 retracement near 4769 to 4800. Traders watching the bounce without a map saw a breakout. Traders following the structure saw a correction running out of room.
Price tagged the zone, stalled right under the 4800.460 invalidation, and turned down. The Wave (5) decline that was mapped out in advance is now active.
Why did the 4750-4800 zone matter for XAUUSD?
That region was not picked at random. It lines up with the 0.618 Fibonacci retracement of the prior decline, and it sits just below the 4800.460 invalidation level for the count.
Wave (4) corrections inside a larger five-wave decline typically retrace into the 0.382 to 0.618 range of the previous impulse. Gold respecting the upper end of that range, then reversing, is the structure confirming itself in real time.
The chart shows the (Y) leg of the correction stalling right at that 0.618 mark before rolling over. That is not a coincidence, that is Elliott Wave logic playing its usual role.
What does Wave (5) mean for XAUUSD now?
Wave (5) is the final leg down in this larger impulse sequence. On the chart, the projected path points toward the 4090 to 4150 area, extending the decline that started from the Wave (3) low near 4038.
This is the leg where the trend resumes after the correction finishes its job. The (W)-(X)-(Y) structure inside Wave (4) did exactly what corrective waves do: it built a trap for anyone assuming the uptrend was back, then handed the market to sellers again.
The 0.5 retracement near 4633 also lines up on the chart as an intermediate reference inside this new leg down, showing how the retracement levels continue to matter as the decline develops.
What's the lesson from this XAUUSD reversal?
Corrections end. Trends resume. That is the entire game.
Amateur money chases the bounce because it looks like a breakout on a candle chart. Structure-based traders already know where the bounce should die, because the wave count told them months in advance.
The 4800.460 level remains the line in the sand. Above it, the bearish Wave (5) count for XAUUSD is invalidated. Below it, the decline stays on schedule.
Gold did not do anything unusual here. It did what Wave (4) corrections inside Elliott Wave structures almost always do: retrace into the expected zone, then hand control back to the dominant trend.
Key Takeaways
- •XAUUSD reversed precisely at the 4750-4800 zone, the 0.618 Fibonacci target for Wave (4).
- •The Wave (5) decline in XAUUSD is now active, projected toward the 4090-4150 region.
- •The 4800.460 level is the invalidation point for the current bearish XAUUSD wave count.
- •Wave (4) in XAUUSD unfolded as a (W)-(X)-(Y) correction before rejecting at resistance.
- •The 0.5 retracement near 4633 marks an intermediate reference inside the new XAUUSD decline.
Frequently Asked Questions
What invalidates the bearish XAUUSD Elliott Wave count?
A break above the 4800.460 level would invalidate the current Wave (5) decline scenario for XAUUSD, since that level marks the top of the Wave (4) correction.
Why did XAUUSD reverse near 4750-4800?
That zone corresponds to the 0.618 Fibonacci retracement of the prior decline, a common completion area for Wave (4) corrections before the trend resumes.
What is the next target for XAUUSD after the Wave (4) rejection?
The current Elliott Wave count projects a Wave (5) decline toward the 4090-4150 region, extending the move below the earlier Wave (3) low.
Disclaimer: This analysis is for educational purposes only and does not constitute financial advice. Elliott Wave analysis involves subjective interpretation. Always do your own research and manage your risk accordingly.
Get Full Coverage for All 27 Instruments
Premium members receive daily wave counts with entry zones, targets and invalidation levels, published daily across all 27 instruments.
View Premium Plans