XAUUSD Elliott Wave: Wave (4) Bounce Before Drop to 4,455
Elliott Wave is more than a trading tool. It's a mindset.
Gold traders keep asking the same question every time price bounces: is this the reversal? Elliott Wave traders ask a different one. Which wave are we in, and what does the structure say happens next?
That difference in thinking is the whole game. Most traders react to price with fear or greed. They buy XAUUSD because it feels cheap after a drop. They sell because they're scared of losing more. None of that has anything to do with structure.
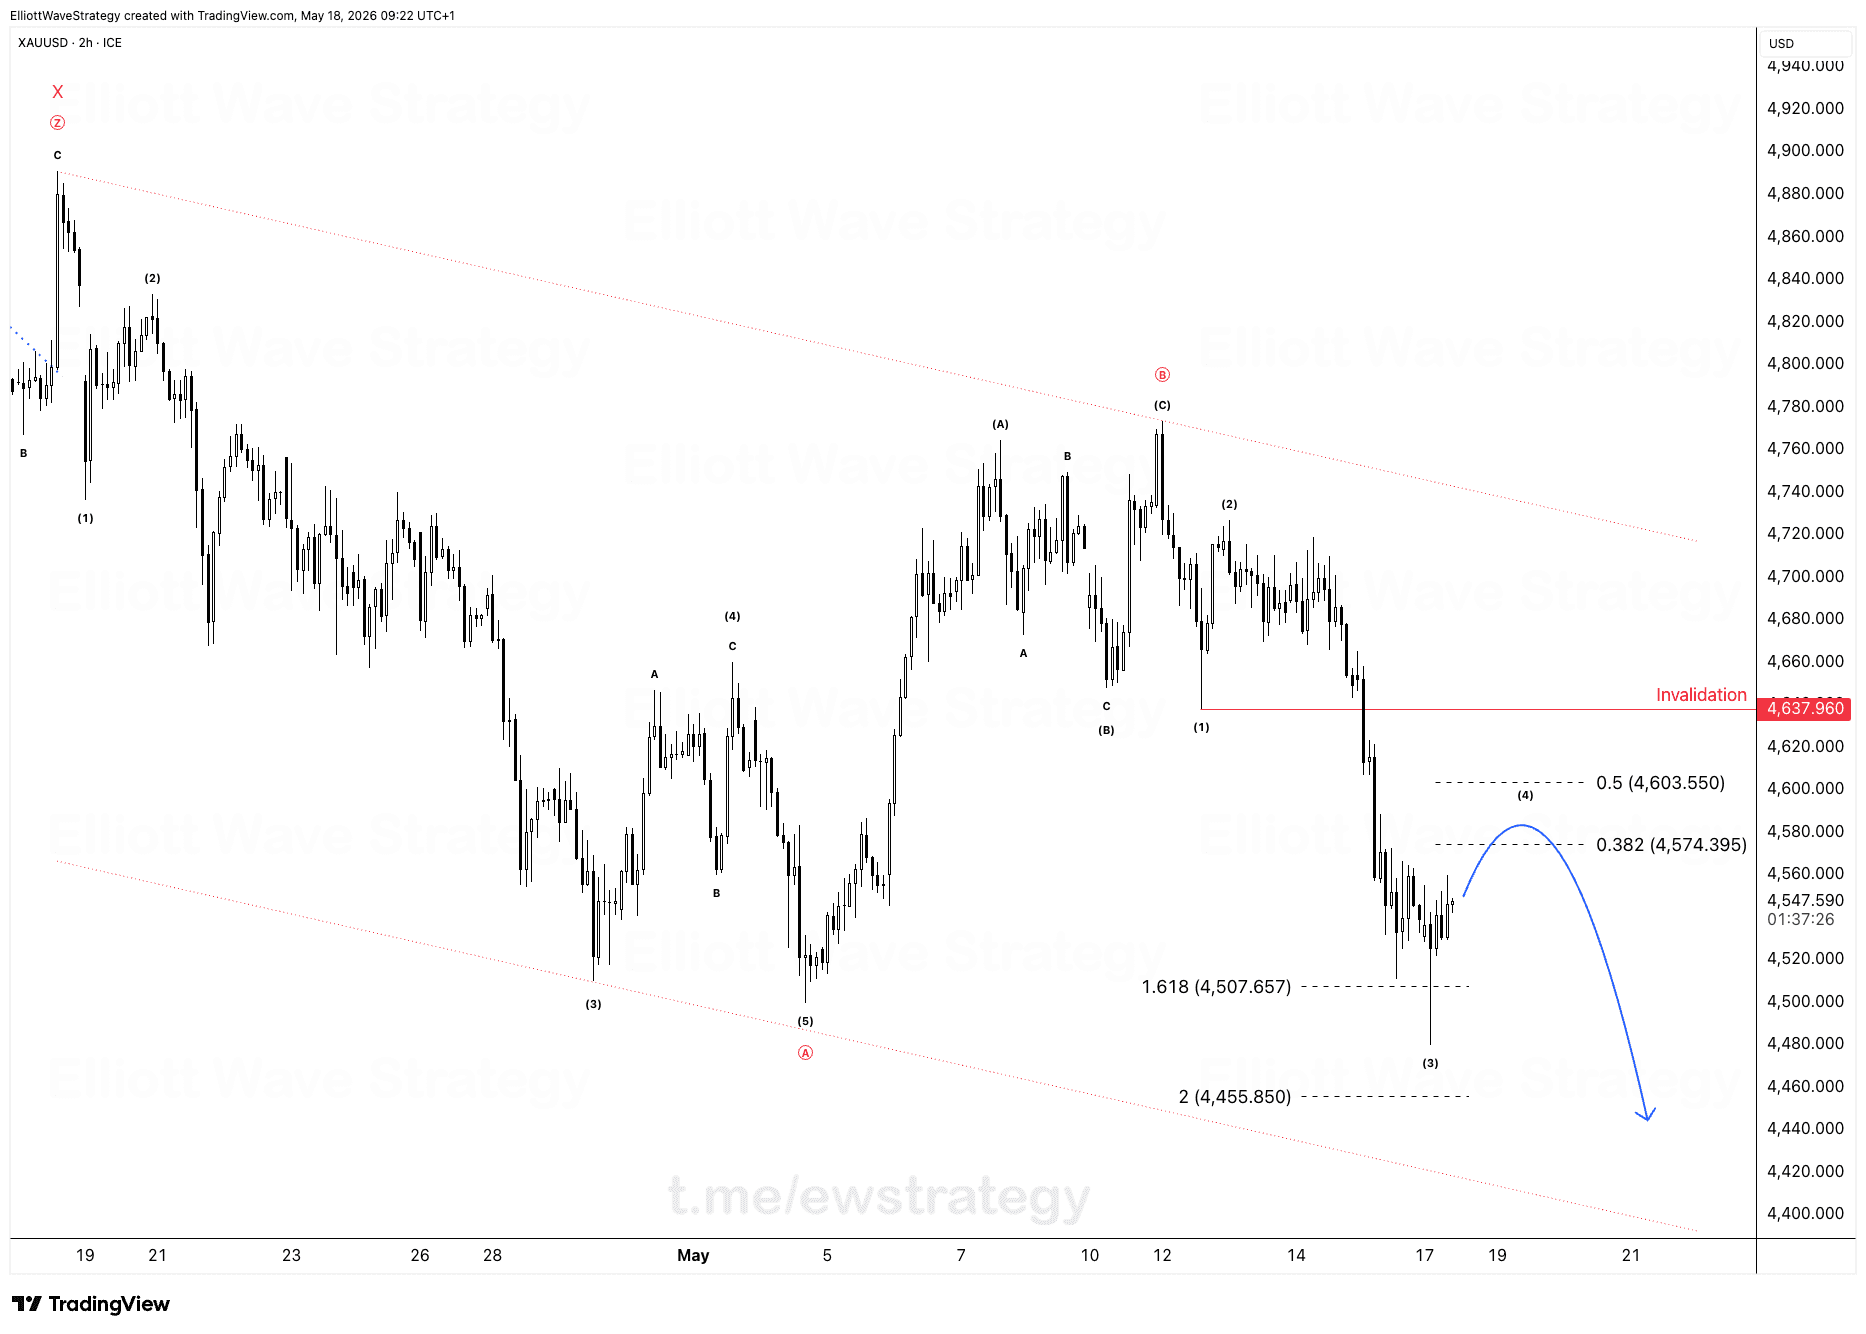
On the XAUUSD 2h chart, the structure is doing the talking. Price completed a five wave decline into wave (3) near 4,507, hitting the 1.618 extension almost to the pip. Since then, gold has been carving out a corrective bounce, labeled wave (4).
What does the wave (4) structure tell us about XAUUSD right now
Wave (4) is a correction, not a new uptrend. The move down from the (C) top near 4,780 into wave (1), then the bounce into wave (2), then the sharp wave (3) decline into 4,507, is a clean impulsive sequence. Corrections after a strong wave (3) are normal. They are not a signal that the downtrend is over.
The chart marks two Fibonacci retracement levels for this bounce: 0.382 at 4,574 and 0.5 at 4,603. The drawn path on the chart shows price rolling over somewhere in that zone before turning back down. That is what a typical wave (4) looks like inside a larger five wave decline: a pause that retraces part of wave (3), not all of it.
Why the 4,637 invalidation level matters more than the bounce itself
The chart marks 4,637 as the invalidation level for this bearish count. As long as XAUUSD stays below that level, the wave (4) correction remains a correction. A trader driven by emotion sees a bounce and starts asking whether gold is done falling. A trader driven by structure knows the invalidation level is the only thing that actually changes the count.
This is the mindset shift Elliott Wave forces on you. You stop asking whether gold will go up or down today. You start asking what the current wave count requires to stay valid, and you let that answer guide you instead of your feelings about the last candle.
What comes after wave (4) completes on XAUUSD
If the wave (4) bounce completes in the 4,574 to 4,603 zone as the chart projects, the next leg is wave (5) down. The chart's drawn trajectory extends toward the 2.0 extension near 4,455, which would complete the five wave impulse from the (C) high.
Zoom out and this whole move down is itself wave (A) of a larger correction. The B and (B) labels higher on the chart, along with the X and circled Z at the top, show this decline sits inside a bigger corrective structure that started well above current prices. Every piece nests inside a bigger piece. That is the pattern amateur traders never bother to study, and it is exactly why they keep getting surprised by moves that wave counters saw coming.
The takeaway for anyone watching gold right now
Corrections teach patience. Impulses teach discipline. Every completed wave on this XAUUSD chart is a data point, not a reason to panic or chase. The structure says wave (4) is a bounce inside a downtrend until 4,637 says otherwise.
Key Takeaways
- •XAUUSD is tracing a wave (4) correction after wave (3) hit the 1.618 extension near 4,507.
- •The chart's drawn path shows XAUUSD bouncing toward the 0.382 to 0.5 retracement zone (4,574 to 4,603) before turning lower again.
- •The invalidation level for the bearish XAUUSD count sits at 4,637.960; a close above it changes the structure.
- •A projected wave (5) decline on XAUUSD targets the 2.0 extension near 4,455.850.
- •This entire decline in XAUUSD is itself part of a larger corrective wave (A) inside a bigger pattern.
Frequently Asked Questions
What invalidates the bearish XAUUSD wave count?
A move back above 4,637.960, the level marked on the chart, would invalidate the current wave (4) correction count and force a reassessment of the structure.
Why is the current XAUUSD bounce not a trend reversal?
The bounce is labeled wave (4), a corrective wave inside a larger five wave decline from the (C) high. Corrections retrace part of the prior impulse but don't erase it, and the structure only turns bullish if price breaks the invalidation level.
What is the next target if wave (4) on XAUUSD completes as expected?
The chart projects a wave (5) decline toward the 2.0 Fibonacci extension near 4,455.850, which would complete the five wave impulse down from the recent (C) top.
Disclaimer: This analysis is for educational purposes only and does not constitute financial advice. Elliott Wave analysis involves subjective interpretation. Always do your own research and manage your risk accordingly.
Get Full Coverage for All 27 Instruments
Premium members receive daily wave counts with entry zones, targets and invalidation levels, published daily across all 27 instruments.
View Premium Plans