XAUUSD Elliott Wave: Triangle Squeeze Points to Wave X Low
There are two kinds of traders right now.
There are two kinds of traders watching Gold right now.
One is staring at Gold, Oil, DXY, EURUSD and feeling something is about to happen, without knowing what to do about it. The other already has the plan. Levels written. Invalidation set. Risk calculated. Waiting for the trigger. When the impulse fires, only one of them is ready.
What does the XAUUSD chart actually show right now?
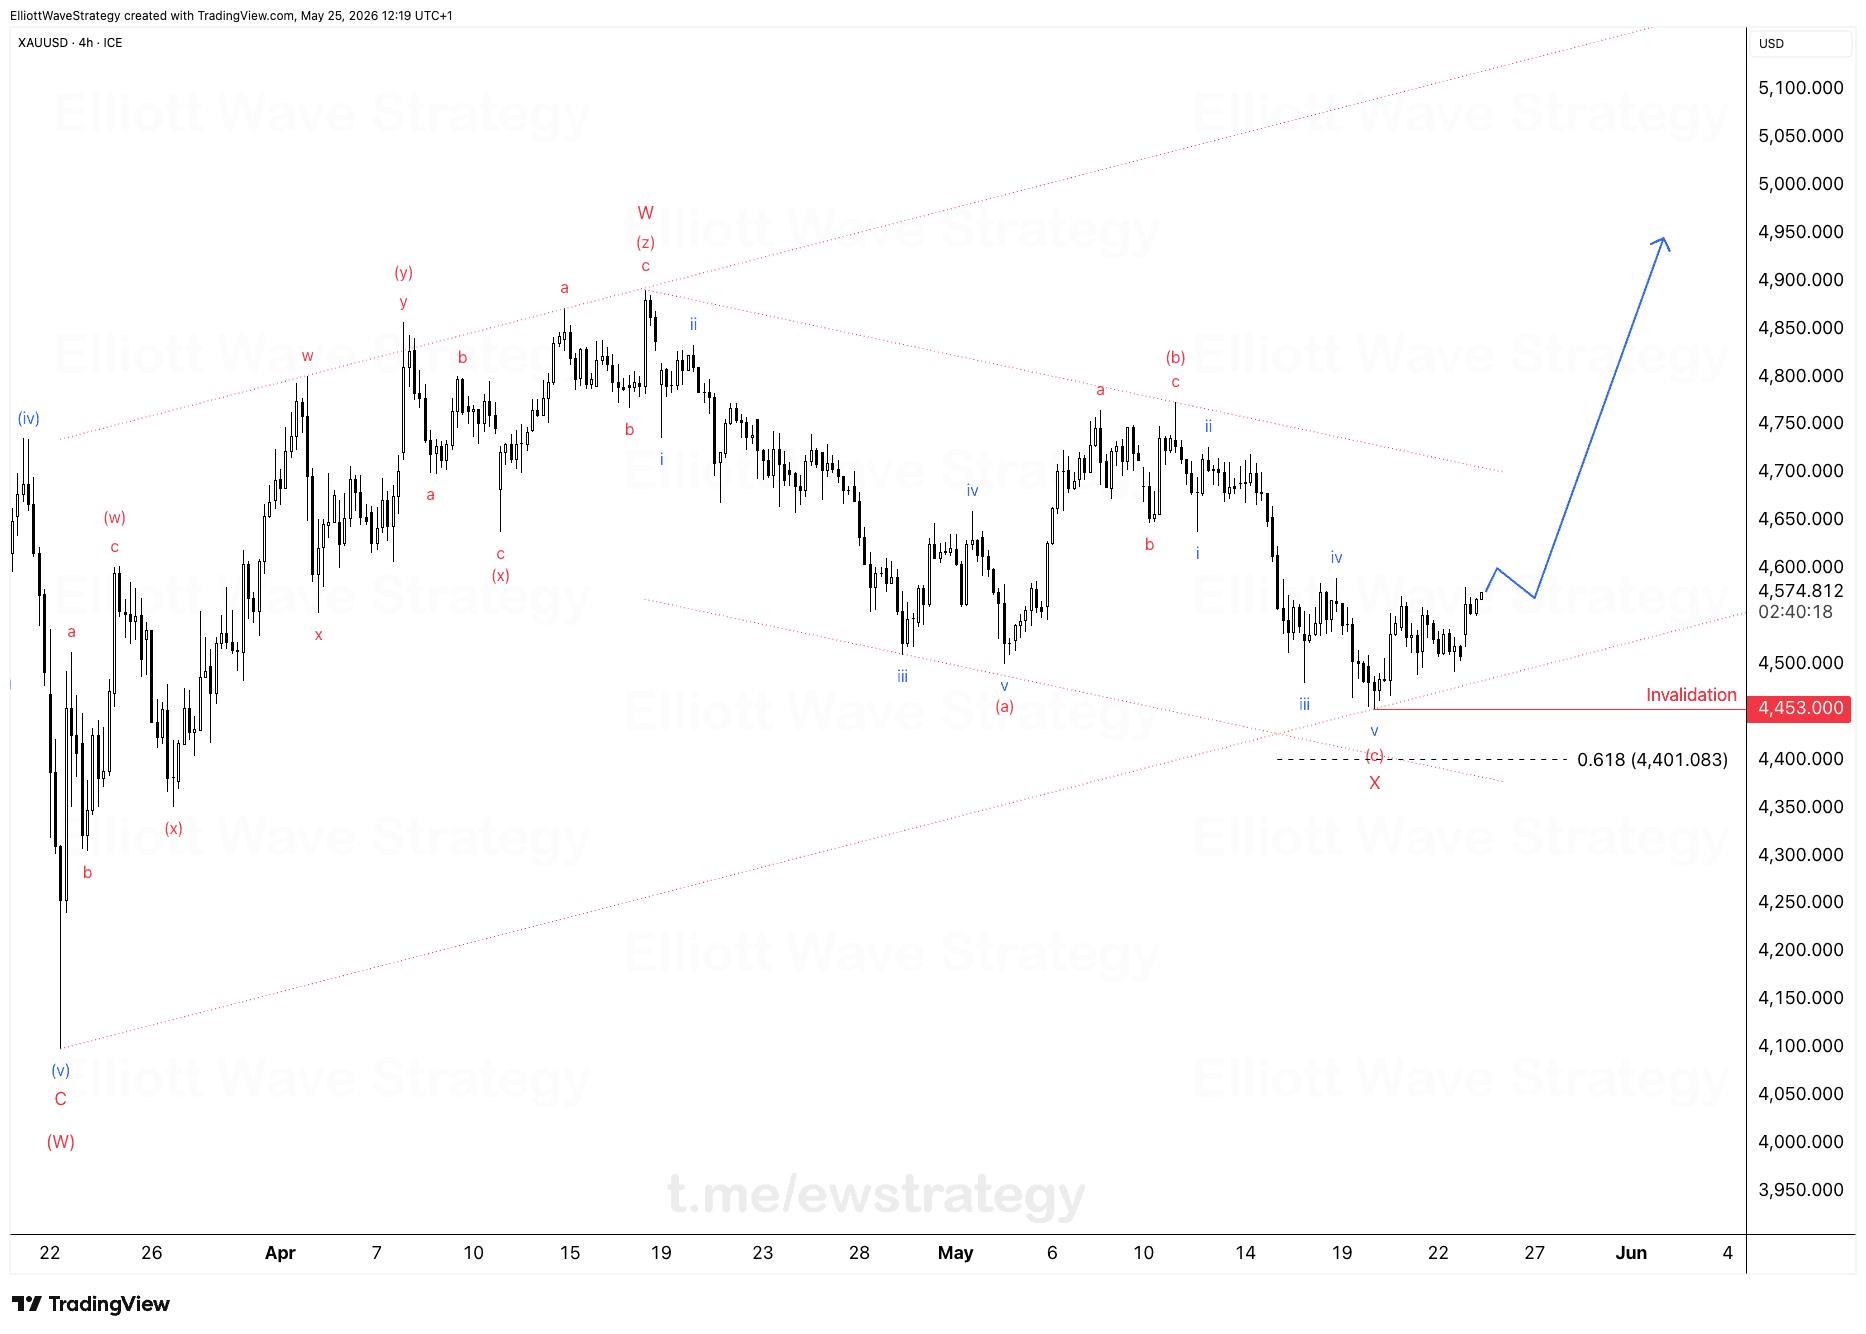
Gold is tracing a complex corrective structure on the 4H chart. From the (W) low near 4,100, price built a (v) impulse up into wave (iv), then continued higher through a zigzag labeled (w)-(x)-(y), extending into a (z) leg that topped out above 4,900.
Since that top, price has been carving a five wave decline inside a contracting shape: i, ii, iii, iv, v down into what's now marked as wave (c) of X. The whole move down from the highs is bounded by converging red trendlines, the classic look of a triangle or a terminal corrective structure squeezing toward its apex.
Multiple wave counts are still valid here. That's not a hedge, it's the honest state of the chart. The structure hasn't confirmed its next direction yet.
Why does the 4,453 invalidation level matter?
The invalidation is marked directly on the chart at 4,453. Below that, the 0.618 retracement sits at 4,401.083, a natural target zone for wave (c) of X to complete if the corrective decline extends slightly further before turning.
This is the level that separates the current corrective reading from something structurally different. A break below 4,453 doesn't just threaten one count, it forces a re-evaluation of the entire wave X labeling. That's why it's marked, not guessed at after the fact.
The blue projected path on the chart shows what the next move could look like if wave X completes near the 0.618 zone: a small bounce, a retest, then an impulsive push higher toward the upper trendline of the broader structure and beyond, back toward the prior highs above 4,900.
Why do amateur traders struggle with charts like this?
This is exactly when amateur traders panic and force trades. They see price moving inside the triangle and think they need to do something or they'll miss out. Every small swing feels like a signal.
Professional traders look at the same chart and think differently. They map out both scenarios: continuation lower toward 4,401 to complete wave X, or an early turn from current levels. They identify the exact levels that confirm or invalidate each count. They calculate risk for either outcome. Then they wait.
The difference was never about predicting which way Gold breaks. The difference is having a plan for both directions before the market decides for you.
What comes next for Gold?
The next impulse is coming. The contracting structure on the 4H chart won't hold forever, triangles and complex corrections resolve eventually, usually with a sharp move that catches the undecided crowd flat-footed.
Plan the trade. Trade the plan. Everything else is gambling.
Key Takeaways
- •XAUUSD is tracing a complex corrective structure bounded by converging trendlines on the 4H chart.
- •The invalidation level for the current XAUUSD wave count sits at 4,453.
- •A 0.618 retracement near 4,401.083 marks a possible completion zone for wave (c) of X in Gold.
- •Multiple wave counts remain valid for XAUUSD until price breaks decisively above or below the marked levels.
- •The projected path for Gold points toward a resumed impulsive advance once wave X completes.
Frequently Asked Questions
What invalidates the current XAUUSD wave count?
A break below 4,453 invalidates the current corrective reading on the XAUUSD 4H chart and would force a re-evaluation of the wave X structure.
What is the 0.618 level on the XAUUSD chart for?
The 0.618 retracement at 4,401.083 marks a zone where wave (c) of X could complete before Gold turns higher, based on the current Elliott Wave count.
Why hasn't the XAUUSD structure confirmed its next direction?
Gold is still inside a contracting corrective pattern with multiple valid wave counts, so the chart needs a break of either the invalidation level or the upper trendline to confirm direction.
Disclaimer: This analysis is for educational purposes only and does not constitute financial advice. Elliott Wave analysis involves subjective interpretation. Always do your own research and manage your risk accordingly.
Get Full Coverage for All 27 Instruments
Premium members receive daily wave counts with entry zones, targets and invalidation levels, published daily across all 27 instruments.
View Premium Plans