XAUUSD Elliott Wave: Wave (4) Bounce Before New Lows?
The market has no mercy and takes no prisoners. If you fall in love with your analysis, you will move your stop and bleed for it.
Gold has no mercy. It does not wait for you, and it does not care what you think of your own analysis.
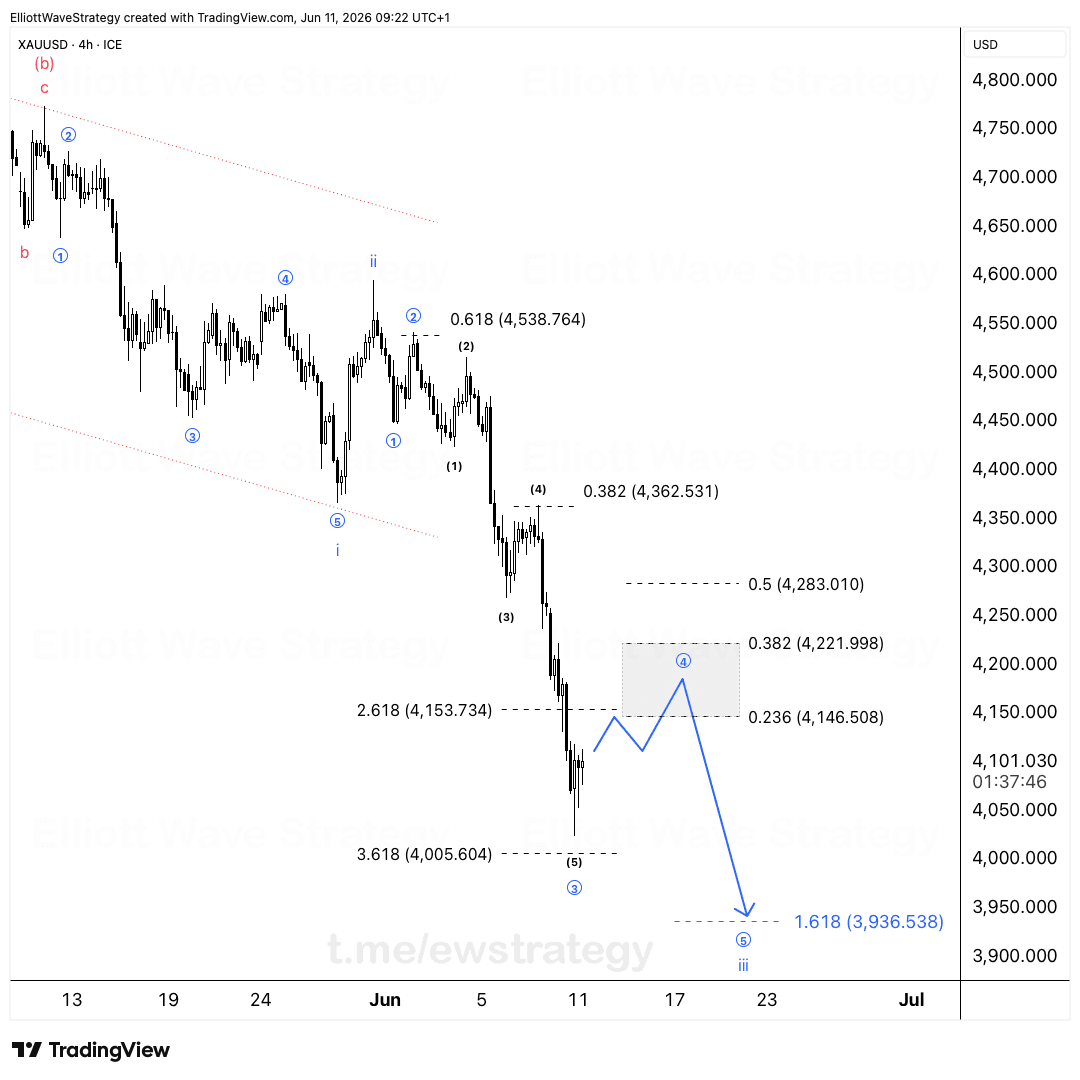
Wave (3) on XAUUSD completed near 4,005, right where the structure pointed. That drop was sharp, and anyone still looking for higher highs during it got run over. Now the chart is tracking the corrective bounce inside Wave (4), and this is exactly the phase where traders start arguing with the market instead of reading it.
Where is XAUUSD in the Elliott Wave count right now?
The 4h chart shows a five wave decline from the Wave (2) high near 4,538. Wave (1) down, Wave (2) up, Wave (3) impulsive and fast into 4,005, and now Wave (4) building as a corrective bounce. Inside Wave (3) itself, the sub-waves labeled ①through ⑤ show the internal structure, with wave ③ of that sequence extending hard into the 4,153 zone before wave ⑤ pushed to the 4,005 low.
Wave (4) corrections are rarely clean. They chop, they fake out both directions, and they test the patience of anyone holding a bearish bias. The current structure points to a bounce that could stretch toward the 0.236 retracement near 4,146 and as far as the 0.382 level near 4,222 before buyers run out of road.
Why does the 4,146-4,222 zone matter for Wave (4)?
Those levels are Fibonacci retracements of the Wave (3) decline, marked directly on the chart at 0.236 (4,146.508) and 0.382 (4,221.998). A Wave (4) bounce that respects this zone keeps the larger bearish structure intact and sets up the final leg down.
The drawn projection on the chart shows price rising into this shaded zone, then turning down again toward the 1.618 extension near 3,936.538, labeled as Wave (5) or wave iii of a lower degree. That is the setup: corrective strength now, then one more leg lower to complete the larger impulse from the highs.
What happens if you get attached to the count?
This is where the post gets sharp, and for good reason. The market changes every second. If you fall in love with your Wave (4) target and refuse to adjust when price action tells you something different, you will move your stop and bleed for it.
Professional traders do not marry their counts. The structure is a living thing on Gold right now, not a fixed prediction. If Wave (4) extends beyond the 4,222 zone or the internal shape shifts, the count gets re-evaluated immediately, not defended out of ego.
This is the entire reason for tracking the structure daily instead of setting a target and walking away. The moment you stop following live price and start trading what you believe should happen, you become exactly the kind of trader the market feeds on.
Bottom line on the XAUUSD Elliott Wave structure
Wave (3) is done near 4,005. Wave (4) is corrective and likely to reach into the 4,146-4,222 band. Wave (5) targets are projected near 3,936.538 if the larger bearish structure holds. None of this is fixed in stone, and that is the point. Burn the old analysis the moment new candles contradict it, and re-analyze from what the chart is actually showing.
Key Takeaways
- •XAUUSD completed Wave (3) near 4,005 on the 4h Elliott Wave count.
- •The current Wave (4) bounce on XAUUSD may extend toward the 4,146-4,222 Fibonacci zone.
- •A projected Wave (5) decline on XAUUSD targets the 1.618 extension near 3,936.538.
- •XAUUSD's Elliott Wave structure remains corrective within Wave (4) and subject to change with new price action.
- •Traders following XAUUSD should treat the 4,146-4,222 zone as a corrective ceiling, not a fixed reversal point.
Frequently Asked Questions
What is the current Elliott Wave count on XAUUSD?
XAUUSD has completed a five wave decline into Wave (3) near 4,005, and price is now in a corrective Wave (4) bounce before a projected final Wave (5) leg lower.
What price zone is Wave (4) on gold expected to reach?
The chart projects the Wave (4) corrective bounce reaching between the 0.236 retracement near 4,146 and the 0.382 retracement near 4,222 before the next decline.
What would invalidate the bearish XAUUSD Wave (5) target?
If the Wave (4) bounce extends well beyond the 4,222 zone or overlaps prior wave structure in a way that breaks the impulsive count, the projection toward 3,936.538 would need to be reassessed.
Disclaimer: This analysis is for educational purposes only and does not constitute financial advice. Elliott Wave analysis involves subjective interpretation. Always do your own research and manage your risk accordingly.
Get Full Coverage for All 27 Instruments
Premium members receive daily wave counts with entry zones, targets and invalidation levels, published daily across all 27 instruments.
View Premium Plans