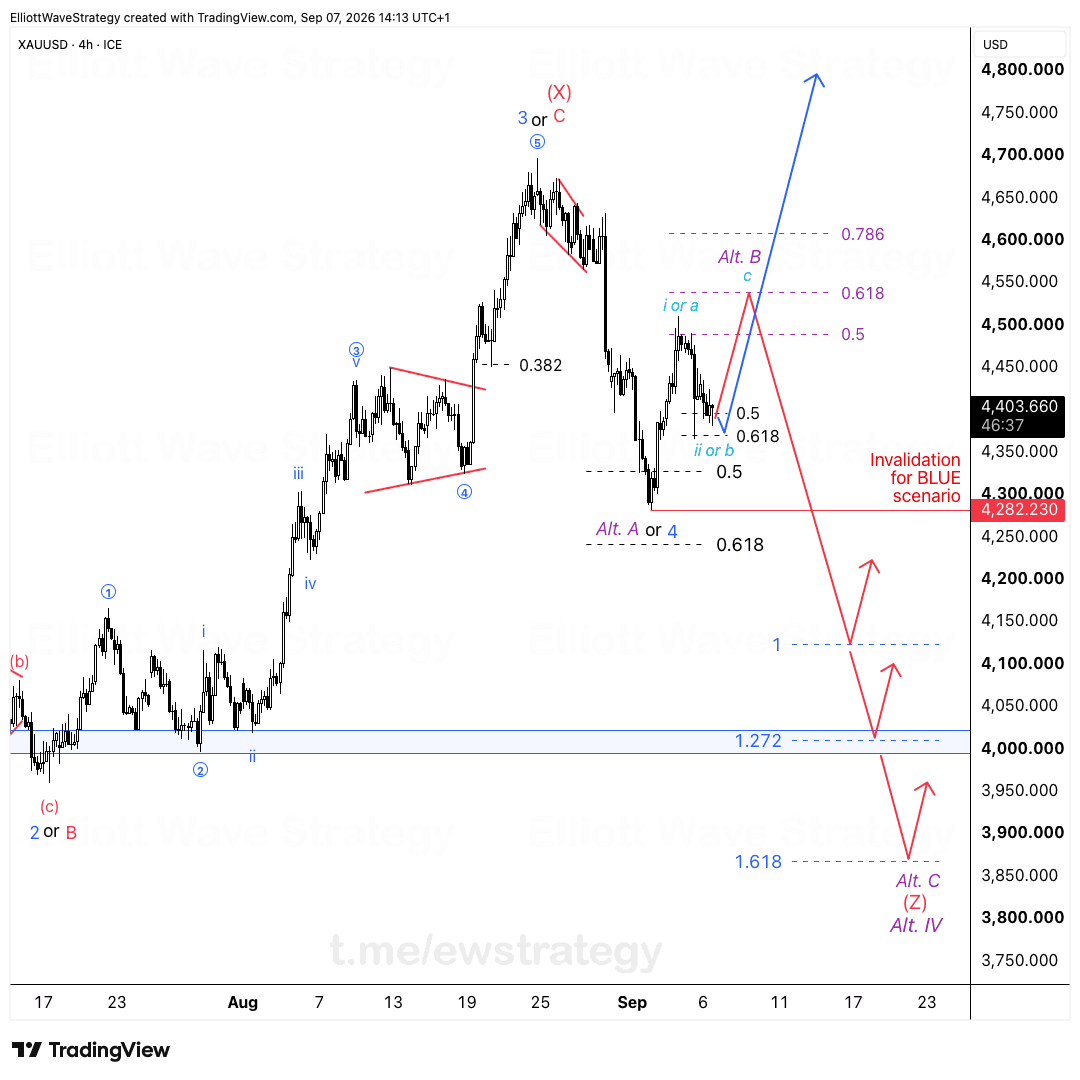
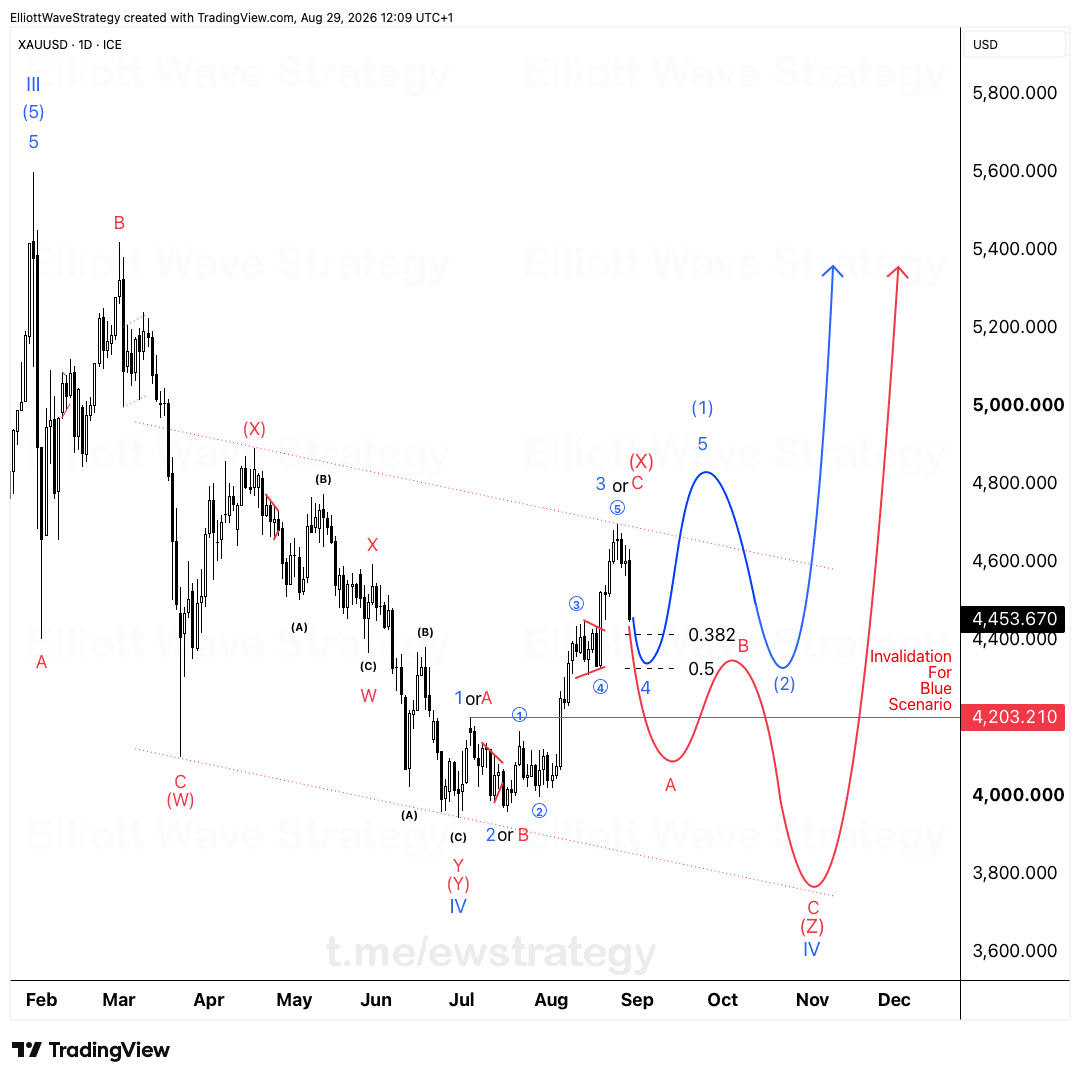
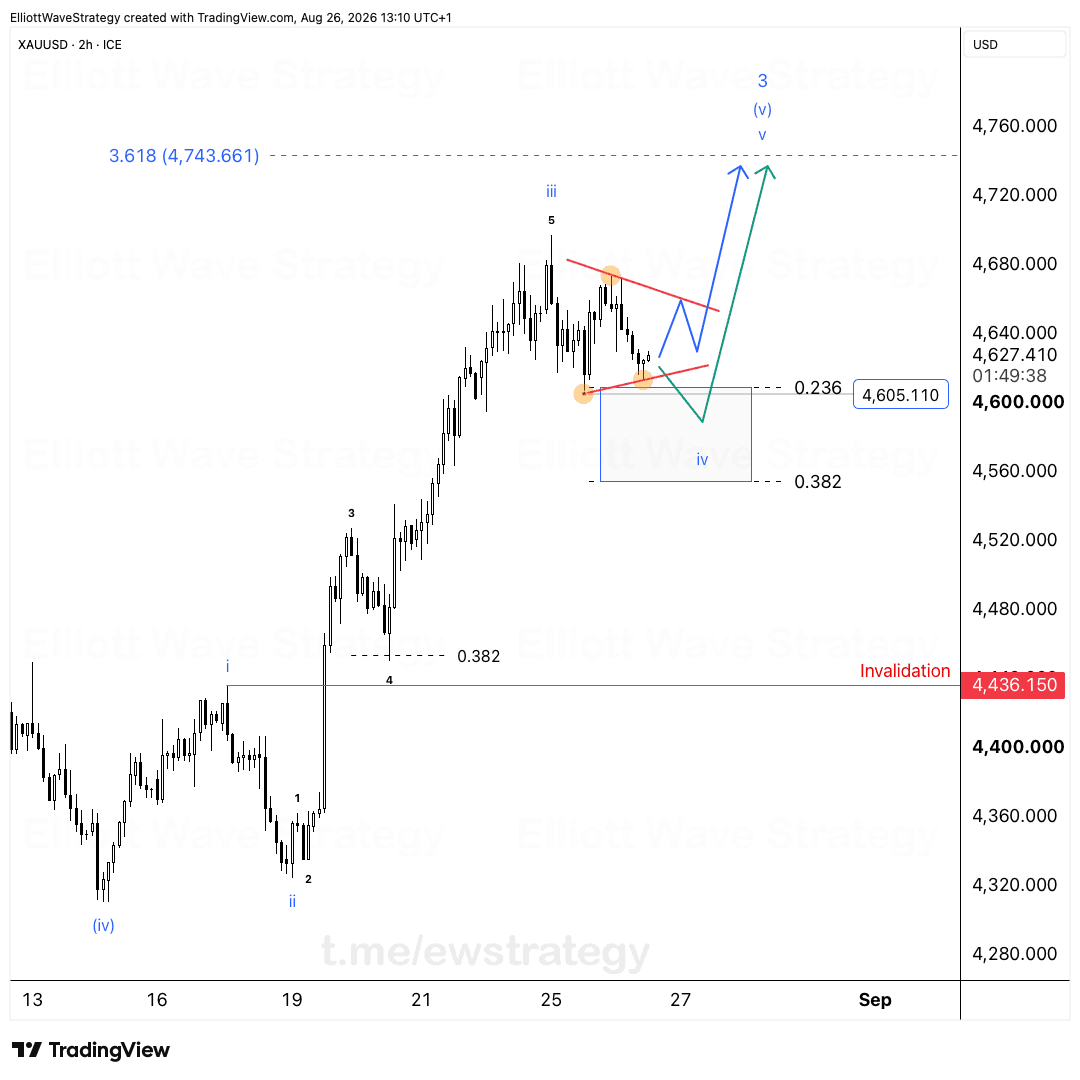
Gold Elliott Wave: Wave 4 Bounce Is the Trap, Not the Bottom
Everyone is calling the bottom right now. That is exactly the problem.
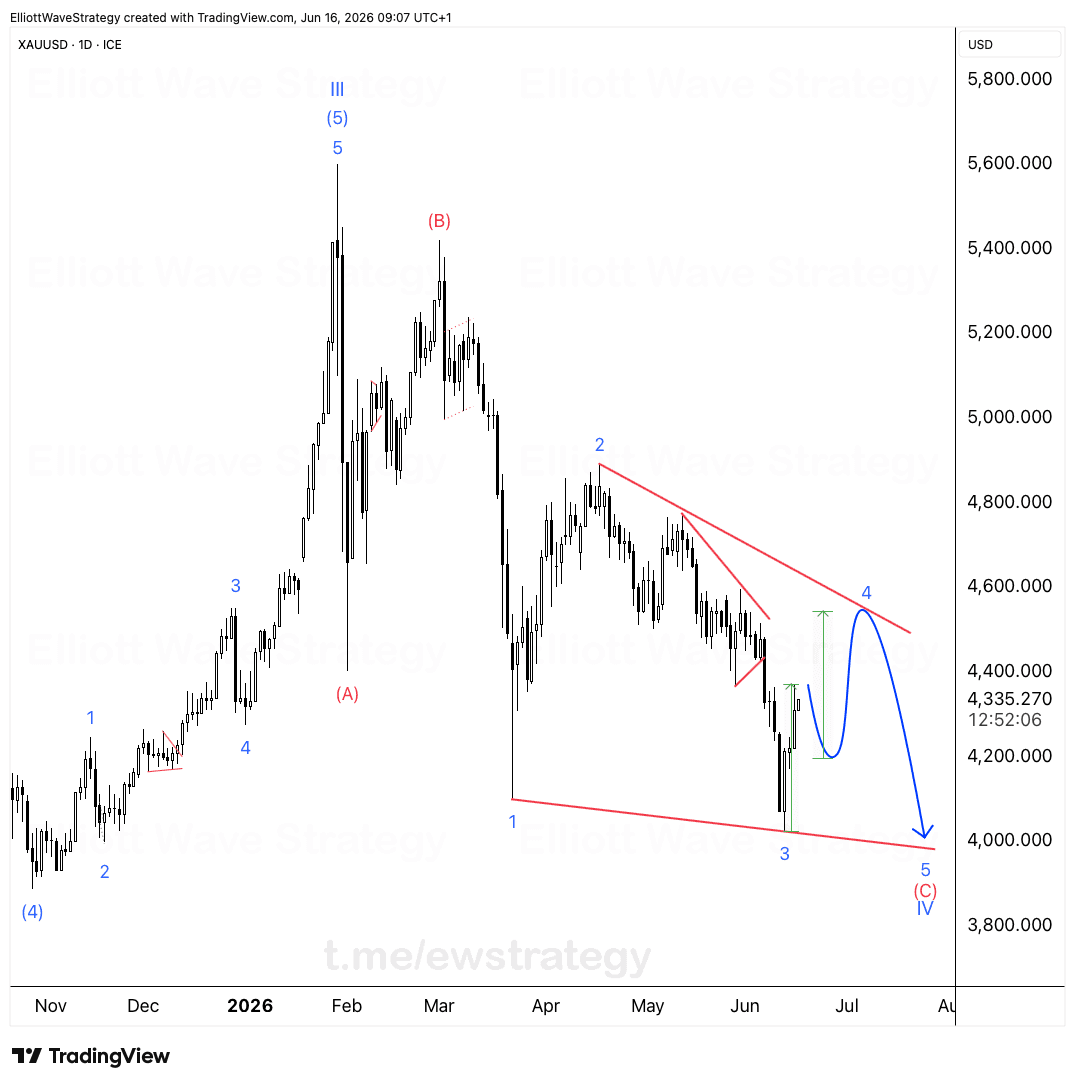
Gold's daily chart is telling a story most traders are not reading correctly right now.
Wave III topped back in February. Since then, gold has been carving out an ABC correction off that high, and Wave (C) of that correction is now tracing its own five waves down. Wave 3 of (C) completed near 4,200. What you're looking at on the chart right now, the bounce off that low, is Wave 4. It's climbing straight into descending trendline resistance.
This is not the reversal everyone is waiting for. This is the trap.
Why is the current gold bounce not a reversal?
A bounce off a low means nothing on its own. Context is everything in Elliott Wave analysis, and the context here is a Wave 4 inside a still-unfinished bearish sequence.
Wave 4 bounces exist to do one thing: pull in buyers right before the trend resumes. That's exactly the setup on XAUUSD's daily chart. The bounce is climbing into a descending trendline drawn off the Wave 2 and prior swing highs. Once price hits that line and exhausts, the structure calls for Wave 5 of (C) to take over.
Amateur traders see a bounce off a low and start buying. Elliott Wave traders see a Wave 4 inside a bearish sequence and wait.
Where does Wave 5 of (C) end?
Wave 5 of (C) points lower, toward the 4,000 region. That's where the entire correction off the February Wave III high finally completes, marked on the chart as Wave IV of the larger bull structure.
This matters because Wave IV completion is not just another low. It's the low that sets up the next leg higher. Once Wave 5 of (C) finishes near 4,000, the corrective structure is done and the bigger degree count turns bullish again.
Why does consensus buying make this setup riskier?
When every retail account is screaming to buy gold at the same time, the market almost never agrees with them. Consensus is not confirmation. It's usually the opposite.
A crowded long trade right into Wave 4 resistance, ahead of a Wave 5 decline, is exactly the kind of setup that punishes recency bias. The people buying the bounce are trading the last five candles. The structure is telling a longer story.
What comes after Wave IV completes?
Once Wave 5 of (C) finishes and Wave IV is in place, the bigger structure points to a full Wave V bull run. That's the move worth waiting for.
The bottom is coming. It is not here yet. The plan is to let Wave 5 of (C) finish its decline toward 4,000, let the structure confirm the turn, and then engage with the next impulsive leg higher rather than guessing at every bounce along the way.
Patience is not passivity here. It's the entire plan. Waiting for Wave 5 of (C) to complete near 4,000 is what separates a structural trade from a reactive one.
Key Takeaways
- •XAUUSD's daily chart shows Wave III topping in February, with an ABC correction still running into Wave (C).
- •The current XAUUSD bounce is Wave 4 of (C), climbing into descending trendline resistance, not a trend reversal.
- •Wave 5 of (C) on XAUUSD points toward the 4,000 region, where Wave IV of the larger structure would complete.
- •Crowded retail buying on gold right now runs against the Elliott Wave count, which still favors one more leg down before the low forms.
- •Once Wave IV completes near 4,000, the structure sets up a full Wave V bull run in gold.
Frequently Asked Questions
Is the current gold price bounce a buy signal?
According to this Elliott Wave count, no. The bounce is labeled Wave 4 of (C), a corrective bounce inside a still-bearish sequence, climbing into trendline resistance before Wave 5 resumes lower.
Where does the XAUUSD correction end under this count?
Wave 5 of (C) is projected to reach the 4,000 region, which would complete Wave IV of the larger bullish structure that began with Wave III topping in February.
What would tell us Wave 5 of (C) is finished?
The structure needs to complete its five-wave decline into the 4,000 area before the correction is considered done and the larger Wave V advance can begin.
Disclaimer: This analysis is for educational purposes only and does not constitute financial advice. Elliott Wave analysis involves subjective interpretation. Always do your own research and manage your risk accordingly.
Get Full Coverage for All 27 Instruments
Premium members receive daily wave counts with entry zones, targets and invalidation levels, published daily across all 27 instruments.
View Premium Plans