AUDUSD Elliott Wave: Bounce Into 0.705 Is Not a Reversal
A bounce is not a reversal. Knowing the difference is the whole game.
A bounce is not a reversal. Knowing the difference is the whole game.
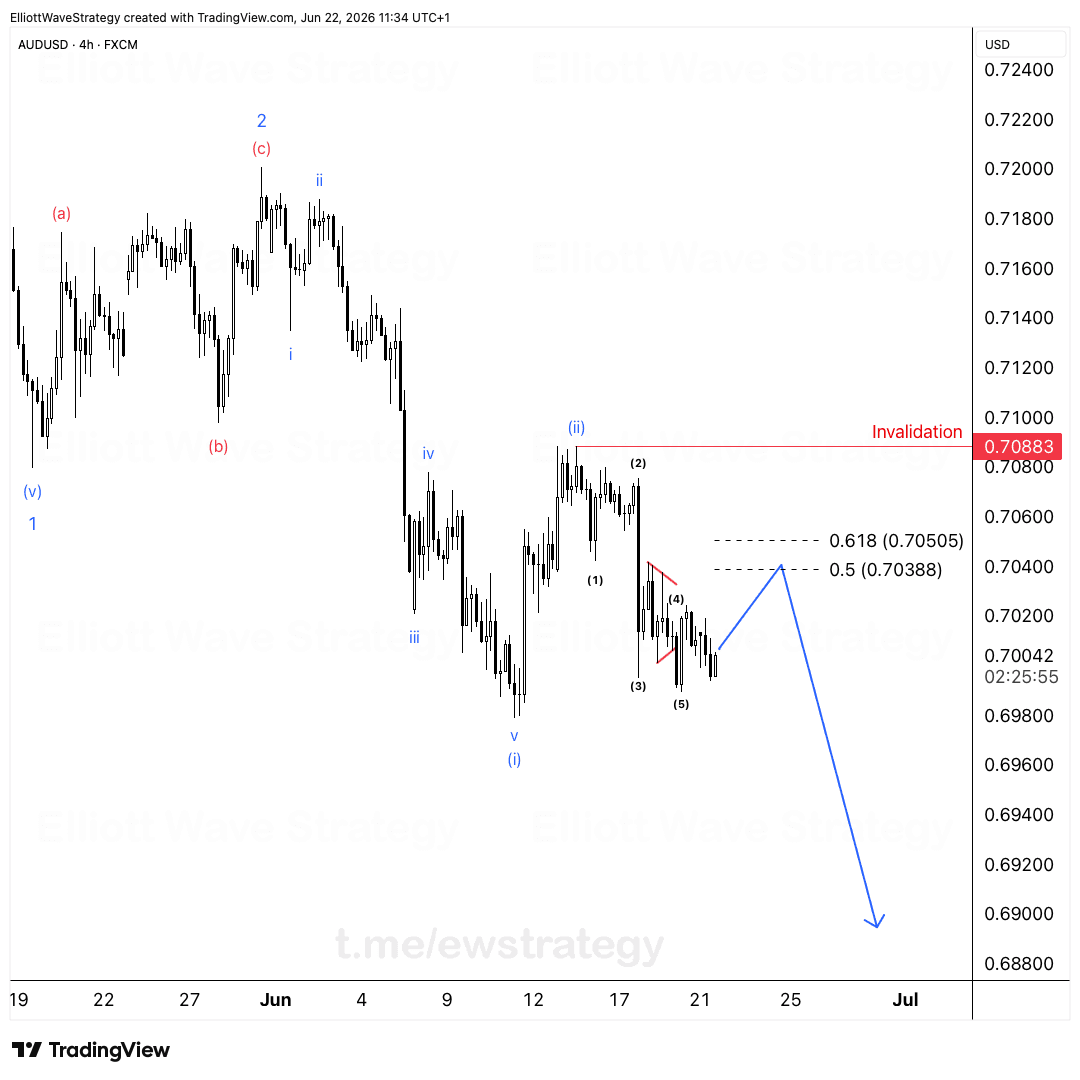
AUDUSD on the 4-hour chart is bearish, and the internal structure is nearly finished carving out its first leg down. Wave 1 completed at the lows. Wave 2 corrected up to 0.7200. Since then, price has been dropping in a clean 5-wave impulse, and that impulse is close to done.
What does the AUDUSD wave count show right now?
Zoom into the H4 chart and you can see waves (1) through (5) of wave (i) clearly labeled. Wave (3) extended lower, wave (4) corrected back up in a small triangle-like structure, and wave (5) pushed to a marginal new low near 0.70042. That completes the five-wave decline that makes up wave (i) of the larger bearish move.
This is the kind of structure that gets mistaken for "the bottom" by traders who only look at price, not wave count. It isn't. It's the end of the first impulse leg down, which means a correction is next, not a reversal of the whole trend.
Why is the next bounce a trap for buyers?
Once wave (i) finishes, wave (ii) takes over. Wave (ii) is a corrective bounce, and the expected target zone sits between the 0.5 and 0.618 Fibonacci retracements of the wave (i) decline, specifically 0.70388 to 0.70505.
Here's what happens next in almost every case like this. Price rallies into that zone. It looks strong. Traders who missed the initial short entry see the bounce and think the low is in. They buy. Then wave (iii) arrives and takes the market sharply lower again, straight through their stops.
This is exactly how amateur accounts get damaged on AUDUSD setups like this one. They confuse a Fibonacci retracement bounce with a change in trend. The trend never changed. Only the correction phase started.
Where does this bearish AUDUSD count get invalidated?
Invalidation is 0.70883. A close above that level cancels the bearish structure completely, because it would mean price has retraced beyond what a normal wave (ii) correction should allow.
As long as AUDUSD stays below 0.70883, the read stays the same: every bounce into the 0.70388 to 0.70505 zone is part of the correction, not the start of a new uptrend. The larger wave (iii) decline is still expected to follow once wave (ii) completes.
What should traders watch for next?
The next move to track is how price behaves once it enters the 0.5 to 0.618 retracement zone. A sharp rejection there, followed by renewed downside momentum, would confirm wave (ii) is complete and wave (iii) is underway.
The trend on AUDUSD is down. The correction just gives a better vantage point to see it play out. We wait for the bounce to show itself before reading what comes after.
Key Takeaways
- •AUDUSD has completed a 5-wave decline into wave (i), based on the H4 Elliott Wave count.
- •The expected wave (ii) bounce on AUDUSD targets the 0.5 to 0.618 Fibonacci zone at 0.70388-0.70505.
- •A close above 0.70883 would invalidate the bearish AUDUSD wave count entirely.
- •Traders buying the AUDUSD bounce into resistance risk mistaking a correction for a trend reversal.
- •Below 0.70883, the AUDUSD bias stays bearish with wave (iii) expected once the correction finishes.
Frequently Asked Questions
What invalidates the bearish AUDUSD Elliott Wave count?
A close above 0.70883 invalidates the bearish structure, since that would exceed the normal retracement allowed for wave (ii).
Why would AUDUSD bounce if the trend is bearish?
Impulse waves are always followed by corrective waves. Wave (ii) is expected to retrace part of the wave (i) decline into the 0.70388-0.70505 zone before the downtrend resumes.
Is the AUDUSD bounce into 0.705 a buy signal?
No. According to the wave count, it's a corrective retracement inside a larger downtrend, and traders who treat it as a reversal risk getting caught by the following wave (iii) decline.
Disclaimer: This analysis is for educational purposes only and does not constitute financial advice. Elliott Wave analysis involves subjective interpretation. Always do your own research and manage your risk accordingly.
Get Full Coverage for All 27 Instruments
Premium members receive daily wave counts with entry zones, targets and invalidation levels, published daily across all 27 instruments.
View Premium Plans