BTCUSDT Elliott Wave: Two Scenarios for Wave 4 at $65K
Trading is not about predicting the future. It's about planning for every scenario.
Trading is not about predicting the future. It's about planning for every scenario.
Wave 4 corrections are the most frustrating part of any trend. They feel uncertain. They test your patience. They make you want to force trades just to feel like you're doing something. BTCUSDT is currently sitting inside exactly this kind of correction, and the chart shows why guessing the pattern is a losing game.
Amateurs try to predict which correction pattern will appear. Professionals prepare for all of them. Look at the current BTCUSDT structure on the 4h chart. We're tracking a complex Wave 4 that could complete as a zigzag, a flat (regular, expanded, or running), a triangle (contracting, expanding, or barrier), or a complex WXY or WXYXZ pattern.
What does the BTCUSDT chart actually show right now?
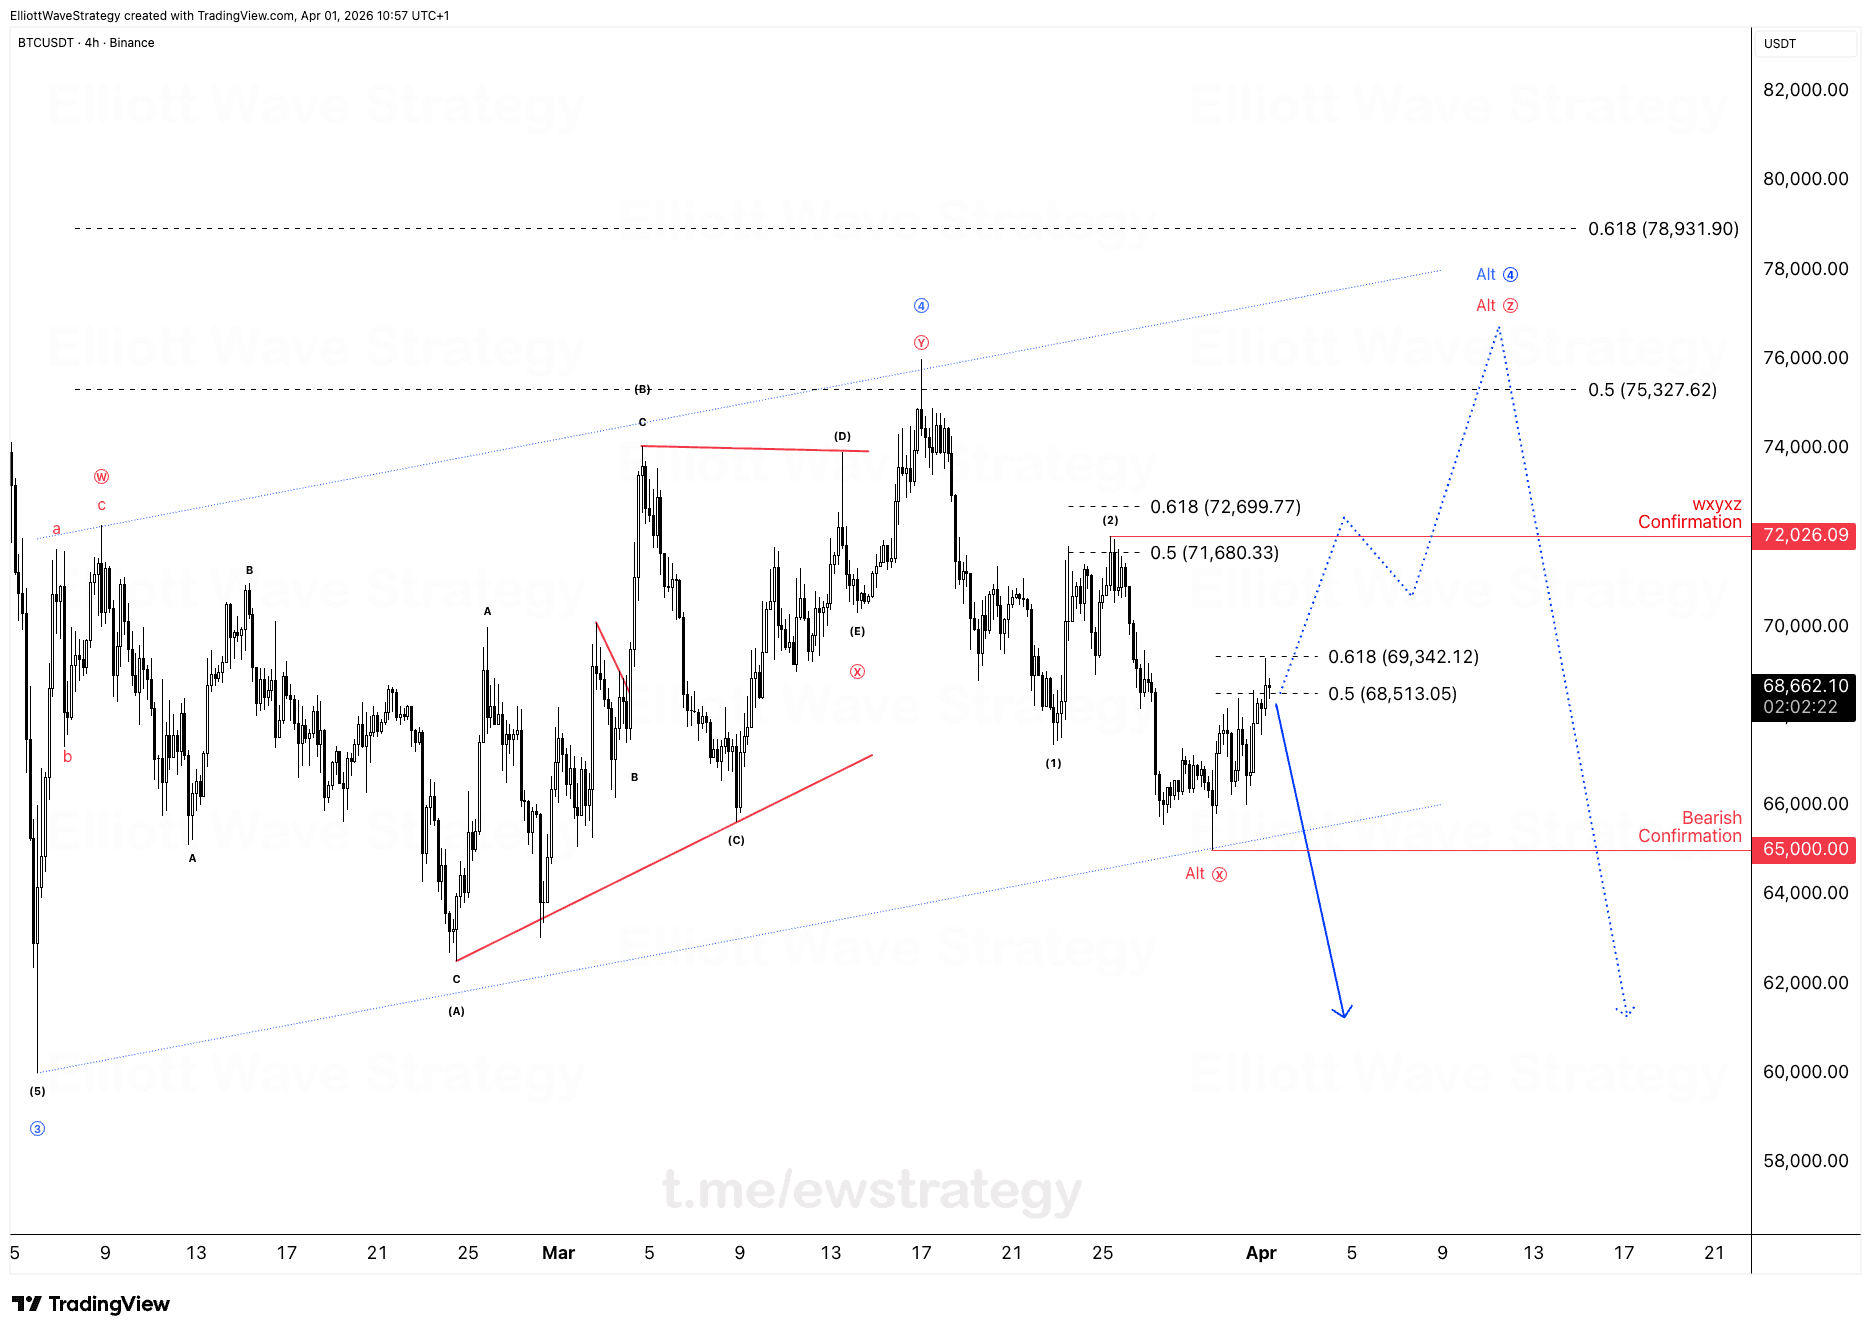
Price completed Wave 3 down near the low, then built a corrective structure labeled with (A), (B), (C), (D), (E) inside an Alt X leg, followed by an Alt Y move up to the marked ④ high near the 0.5 retracement at 75,327.62. From there price rolled over into wave (1) down, a wave (2) bounce that tapped the 0.5 to 0.618 zone between 71,680.33 and 72,699.77, and now sits in a smaller corrective leg near the 68,513.05 to 69,342.12 area.
Each pattern option carries a different internal count and a different completion point. That's exactly why forcing a single label onto this chart right now is the amateur move. The professional approach is to map two clear paths and let price confirm which one is real.
What happens if BTCUSDT breaks below $65,000?
If price breaks below 65,000 directly, Wave 5 has started. That's the bearish confirmation level marked on the chart. The plan here isn't to short the breakdown itself. It's to wait for the first pullback within that new impulse for a higher-RRR entry, since chasing the initial break usually means poor risk to reward.
What happens if BTCUSDT keeps pushing higher instead?
If price continues higher, we track the Z wave correction completion, shown on the chart as the dotted path climbing toward the wxyxz confirmation zone around 72,026.09 and potentially toward Alt ④ near 78,931.90. The key here is confirmation before commitment. Wave 4s typically retrace to the 38.2% Fib level, but trading that level on its own often means accepting low RRR. Patience pays better than guessing which corrective pattern shows up.
Why does the pattern type matter so much for BTCUSDT right now?
A zigzag, a flat, a triangle, and a WXYXZ complex correction all resolve differently in terms of time, depth, and the shape of the next impulse. Trying to lock into one label too early means your invalidation level and your entry logic are built on a guess rather than confirmed structure. The market hasn't decided yet. That's not a problem. That's information.
Trading is process management, not fortune telling. BTCUSDT will show its hand at 65,000 or at the Z wave completion zone. Until then, the job is to wait for one of those two conditions, not to manufacture a trade out of boredom.
Key Takeaways
- •BTCUSDT is inside a complex Wave 4 that could resolve as a zigzag, flat, triangle, or WXYXZ pattern.
- •A direct break below $65,000 on BTCUSDT signals Wave 5 has started, with entries planned on the first pullback.
- •If BTCUSDT continues higher, the Z wave correction needs to complete near the wxyxz confirmation zone around $72,026 before any new plan is set.
- •Wave 4s on BTCUSDT typically retrace to the 38.2% Fib level, but trading that level alone often means low RRR.
- •The BTCUSDT structure hasn't confirmed which corrective pattern is forming, so both bullish and bearish scenarios stay mapped until price decides.
Frequently Asked Questions
What invalidates the bullish BTCUSDT scenario?
A direct break below $65,000 invalidates the idea that BTCUSDT is still correcting higher, since that level marks bearish confirmation that Wave 5 has begun.
What confirms the Z wave scenario on BTCUSDT?
Price needs to hold above the current correction zone and push through the wxyxz confirmation level near $72,026 to support the idea that the Z wave correction is completing rather than reversing.
Why not just trade the 38.2% Fib retracement on BTCUSDT?
Wave 4s often retrace to the 38.2% level, but entering there alone usually means accepting a low risk to reward ratio compared to waiting for confirmed structure after the pattern resolves.
Disclaimer: This analysis is for educational purposes only and does not constitute financial advice. Elliott Wave analysis involves subjective interpretation. Always do your own research and manage your risk accordingly.
Get Full Coverage for All 27 Instruments
Premium members receive daily wave counts with entry zones, targets and invalidation levels, published daily across all 27 instruments.
View Premium Plans