DXY Elliott Wave: Correction Done, New Impulse Down Begins
The market never moves in a straight line. It moves in waves.
The market never moves in a straight line. It moves in waves.
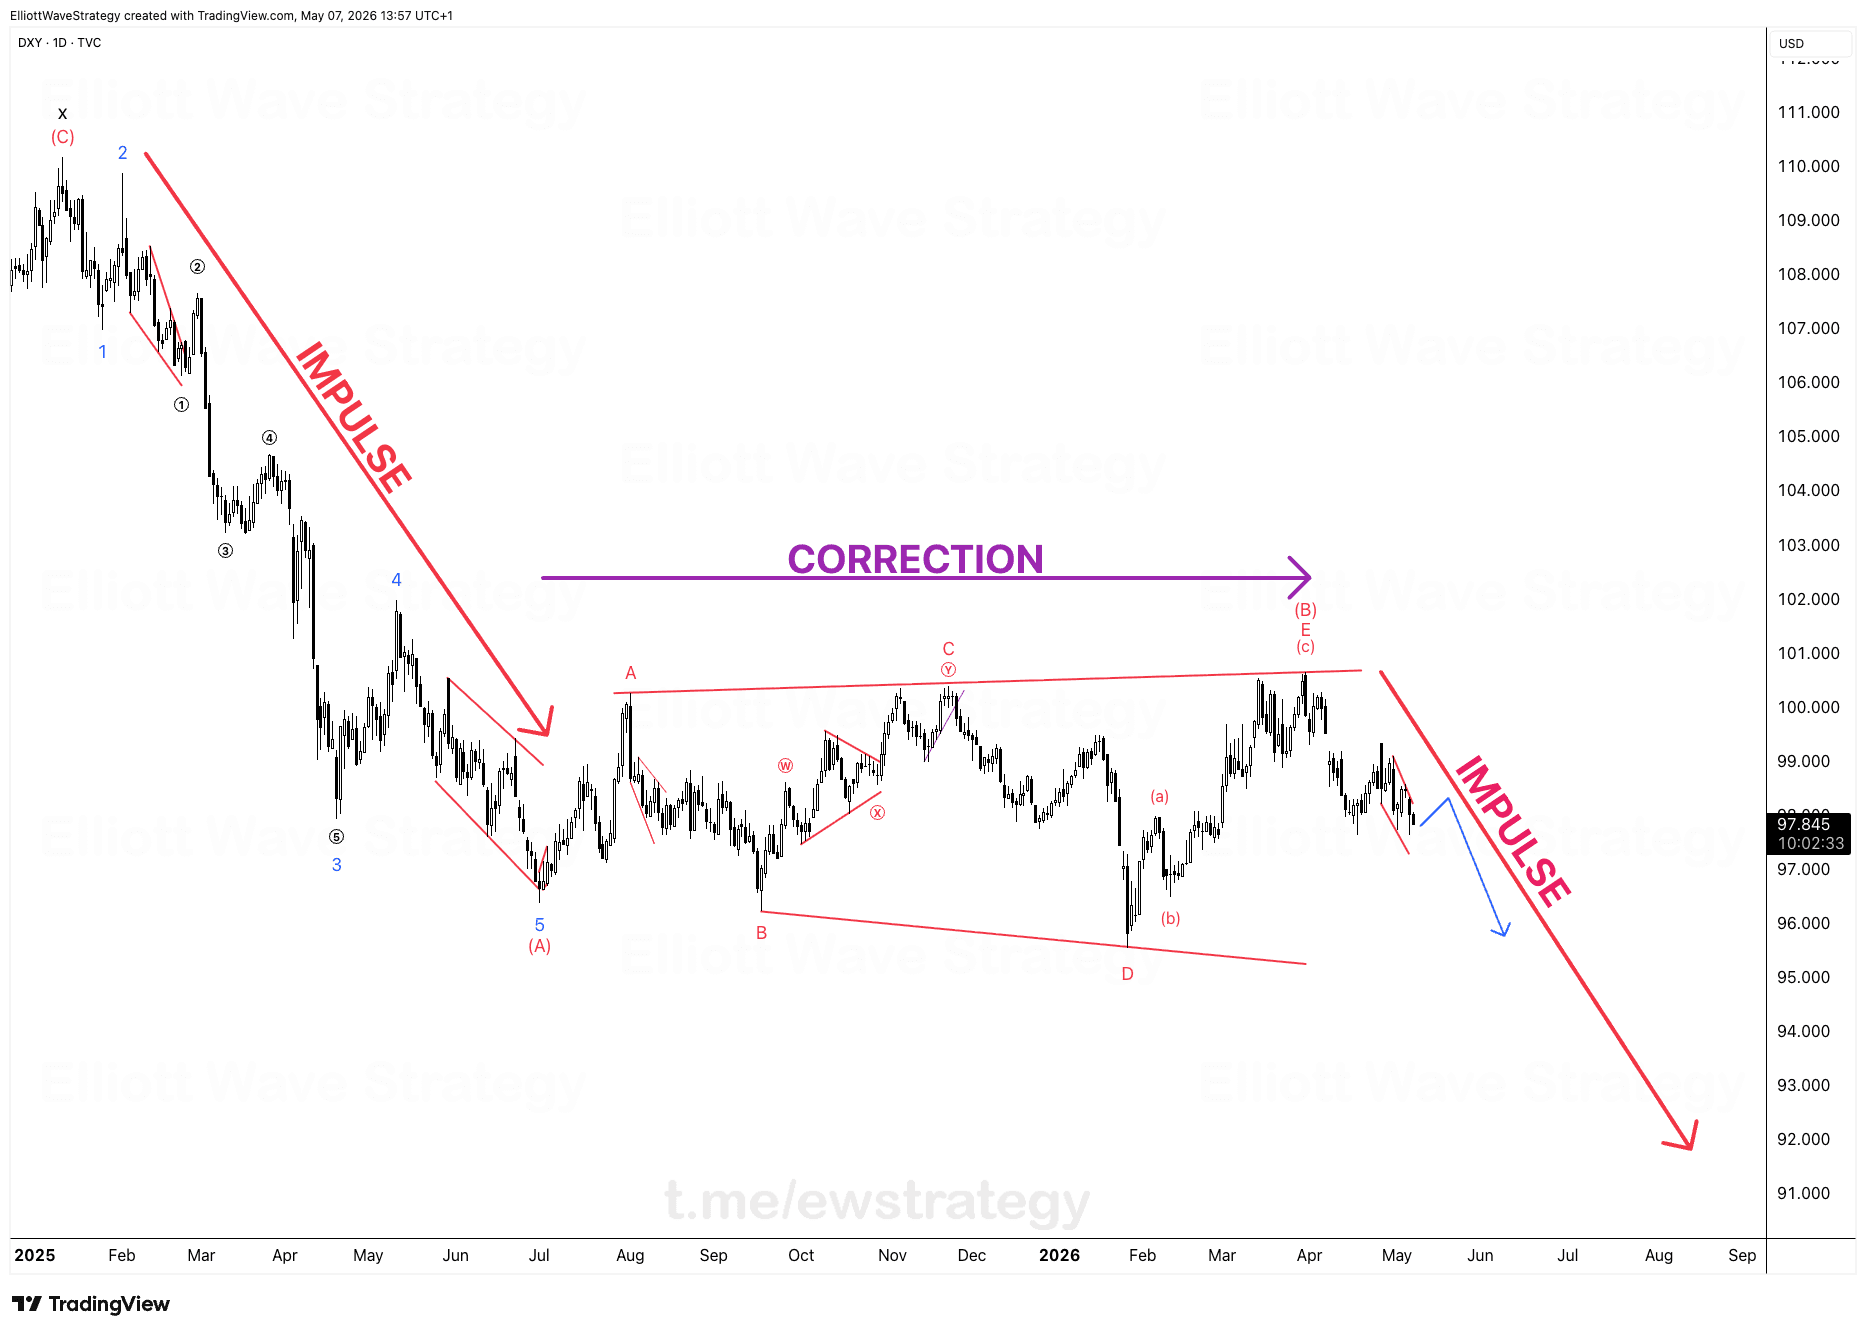
Look at the DXY chart. One big drop into wave (A). A long, grinding correction. And now another drop is starting. This is not random. This is rhythm.
Every market does this. Stocks, gold, forex, crypto. Up, down, up, down. Impulse, correction, impulse, correction. Forever. This is what the Elliott Wave Principle teaches. Once you see it on the DXY chart, you cannot unsee it.
What does the DXY chart actually show?
The left side of the chart is a clean five wave impulse down, labeled 1 through 5, finishing wave (A) near the 97.845 area. That is the first big leg.
From that low, DXY built a long sideways correction. Cetin labels it as a double three: wave W down into a contracting triangle for wave X, then wave Y unfolding as its own A-B-C, with wave C splitting into (a), (b), (c), and the (c) leg itself finishing as an ending diagonal with waves (B) and E marked near the top. That whole purple arrow marked CORRECTION on the chart covers close to a year of price action, from mid-2025 into 2026.
Now the chart shows a small blue arrow turning down from the recent high, followed by a big red arrow and the word IMPULSE, projecting DXY down toward the 92 region. That is the next five wave move Cetin is calling.
Why are wave 1 and wave 2 the hardest part of an impulse?
Here is the truth most traders learn too late. The first two waves are hard. Wave 1 is easy to miss. Wave 2 makes you doubt the count. You feel lost. You feel early. You feel wrong.
This is exactly what happened on the left side of the DXY chart during the first impulse. Wave 1 down was small. Wave 2 retraced hard enough to make the drop look over. Then wave 3 hit and the structure became obvious to everyone, but only after most of the move was gone.
Why does wave 3 matter more than any other wave?
Wave 3 is where the money lives. Big moves. Clean structure. Strong momentum. By the time the news catches up, the wave is already half done.
Most traders see wave 3 on the chart and ask, how did I miss this. Elliott Wave analysts do not ask that question. They were already positioned because they read the correction finishing in real time, not after the fact.
What is the setup on DXY right now?
DXY just finished its correction. The ending diagonal into wave (B) and E capped the move near 101, and price has already turned down through the small blue arrow on the chart. The next impulse is starting.
The first leg of a new five wave decline behaves the same way every time. It starts slow, it gets doubted, and then it accelerates. The plan on DXY is built around that exact rhythm.
The rhythm does not change from market to market. Only the price and the timeframe change. DXY spent the better part of a year correcting sideways, and the chart now shows the next leg of the larger downtrend getting underway.
Key Takeaways
- •DXY completed a multi-leg correction from wave (A) that lasted roughly a year, ending in an ending diagonal near 101.
- •The DXY chart shows a new five wave impulse starting, projected toward the 92 area on Cetin's drawn trajectory.
- •Wave 1 and wave 2 of any impulse are the hardest to trust, and DXY's prior impulse leg showed exactly that pattern.
- •Wave 3 produces the largest, cleanest momentum in an Elliott Wave impulse, which is why reading the correction's end matters for DXY now.
- •The correction on DXY was a double three structure, W-X-Y, with wave Y itself breaking into an A-B-C ending diagonal.
Frequently Asked Questions
Has the DXY correction definitely finished?
Based on the chart, the correction completed as an ending diagonal into wave (B) and E near the 101 area, and price has already turned down from there. A new high back above that ending diagonal would put the corrective count back into question.
Why does Cetin call the DXY move a double three instead of a simple zigzag?
The decline from the (A) low unfolded as wave W, a contracting triangle for wave X, then a full A-B-C for wave Y, which is the structure of a double three, not a single zigzag.
Where is the next DXY impulse expected to go?
Cetin's drawn trajectory on the chart projects the new impulse down toward the 92 region, mirroring the shape and character of the first impulse leg on the left side of the chart.
Disclaimer: This analysis is for educational purposes only and does not constitute financial advice. Elliott Wave analysis involves subjective interpretation. Always do your own research and manage your risk accordingly.
Get Full Coverage for All 27 Instruments
Premium members receive daily wave counts with entry zones, targets and invalidation levels, published daily across all 27 instruments.
View Premium Plans