EURUSD Elliott Wave: WXY Correction Nears 1.1622 Cap
EURUSD 🇪🇺🇺🇸 - (https://s3.tradingview.com/snapshots/2/2RFTmIN3.png)
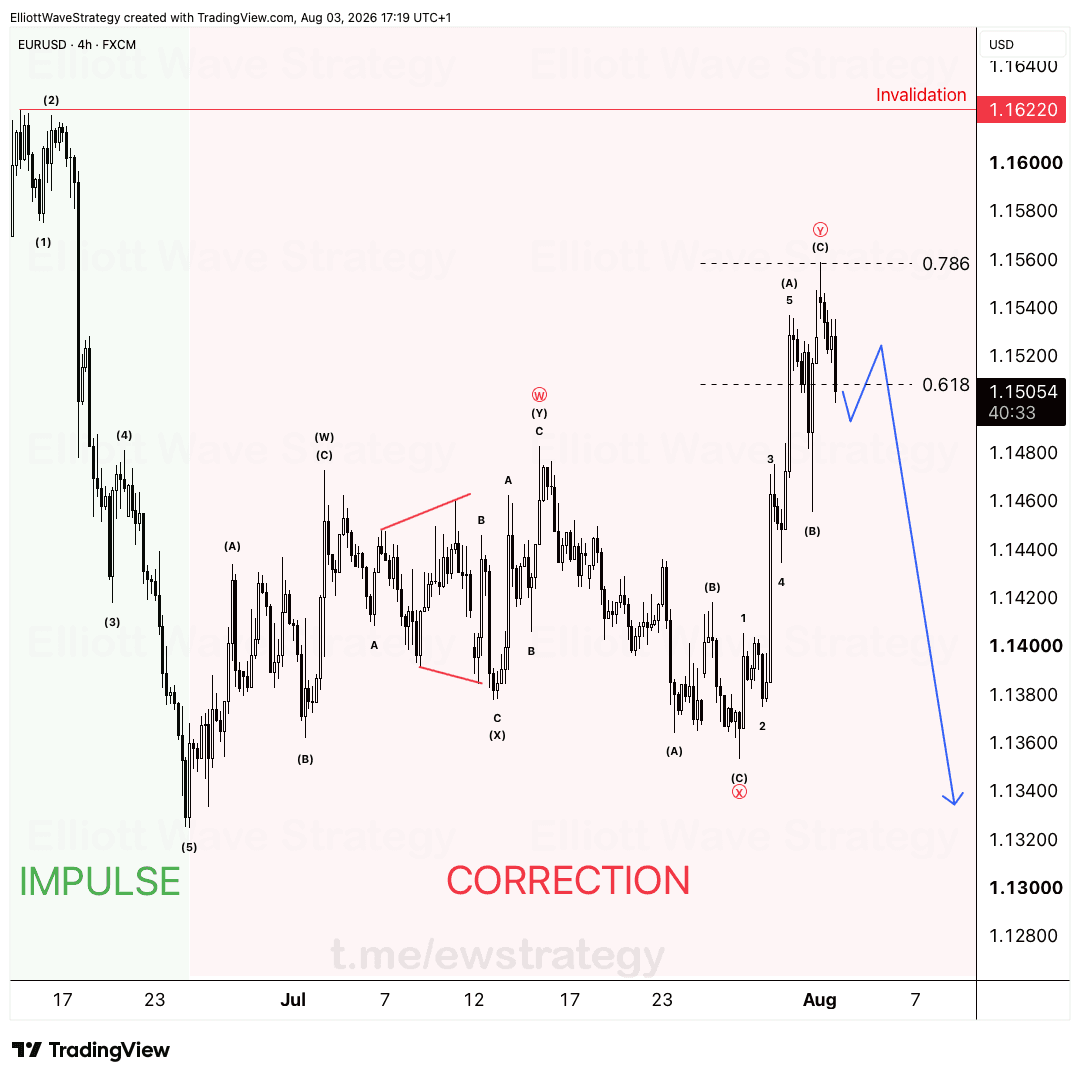
One clean impulse lower. Then a long, messy correction. That's how markets breathe.
The 5-wave decline into (5) on EURUSD isn't up for debate. That leg down was clean, textbook structure with no overlap issues. What came after is a different animal entirely: a WXY correction that's been grinding higher since, testing every ounce of patience traders have.
What does the WXY structure on EURUSD actually show?
After wave (5) bottomed, price built a W wave down into (C), then a corrective B wave (X) higher, then dropped into another C wave to complete the second leg. Now we're inside the Y wave, the final leg of the correction, itself unfolding as a five-wave move labeled 1 through 5 of (C).
Wave 4 inside that Y leg chopped sideways and dragged on for days. That's exactly the kind of price action that makes traders abandon their bias. It shouldn't. Corrective waves are built to test conviction, not to signal a trend change on their own.
Why does the 0.618-0.786 zone matter here?
The Y wave is stretching into the 0.618 to 0.786 retracement zone, sitting around 1.15xx on the chart. Wave 5 of (C) has already completed inside that pocket, and price is curling back down from it.
This zone is where WXY corrections commonly terminate when the Y leg extends beyond a simple equal move. It lines up with where the entire corrective structure since (5) would be considered complete, opening the door for the next impulsive leg to take over.
Where does this bearish EURUSD count get invalidated?
Invalidation sits at 1.16220. Above that level, the corrective read outlined here is wrong and the structure needs to be reassessed from scratch.
Below 1.16220, the door stays open for the next leg down to develop. The chart's drawn projection shows price rolling over from the current zone and heading back toward the 1.13-1.14 region, consistent with a fresh impulsive decline once the WXY correction is done.
How should traders read the chop inside Wave 4 or Y?
Impulses move the market. Corrections just make you doubt it.
Amateurs see the chop of Wave 4 or the grind of a Y wave and start calling for reversals mid-structure. That's backwards. The professional approach is to map the invalidation level first, then wait for price structure to confirm before assuming the correction has actually finished.
The EURUSD chart right now is a case study in exactly that discipline. The impulse down into (5) was never in question. The WXY correction since has taken months and tested plenty of nerves. The next confirmation comes from what price does around the 1.15xx zone relative to 1.16220.
Key Takeaways
- •EURUSD completed a clean 5-wave impulsive decline into wave (5) with no structural ambiguity.
- •The WXY correction on EURUSD has stretched into the 0.618-0.786 retracement zone near 1.15xx.
- •Wave 5 of (C) inside the Y leg has completed and EURUSD is already curling back down from that zone.
- •Invalidation for the bearish EURUSD count sits at 1.16220, above which the corrective structure needs reassessment.
- •Choppy price action inside Wave 4 or Y should not be read as a reversal signal on its own.
Frequently Asked Questions
What invalidates the bearish EURUSD Elliott Wave count?
A move above 1.16220 invalidates the current corrective read on EURUSD. Below that level, the structure remains consistent with a completing WXY correction and room for a new decline.
Why did the EURUSD correction take so long to complete?
The correction is a WXY structure, which combines three separate corrective legs (W, X, Y) rather than a single simple pullback. That combination naturally stretches out over more time and price than a basic zigzag.
What comes after the WXY correction on EURUSD if the count is right?
If the Y wave has completed near the 0.618-0.786 zone as shown on the chart, the next expected move is a fresh impulsive decline, with the chart's drawn projection pointing back toward the 1.13-1.14 area.
Disclaimer: This analysis is for educational purposes only and does not constitute financial advice. Elliott Wave analysis involves subjective interpretation. Always do your own research and manage your risk accordingly.
Get Full Coverage for All 27 Instruments
Premium members receive daily wave counts with entry zones, targets and invalidation levels, published daily across all 27 instruments.
View Premium Plans