GBPAUD Elliott Wave: Why Wave C Traps Bulls Before Drop
The Psychology Behind ABC Corrections 🧠
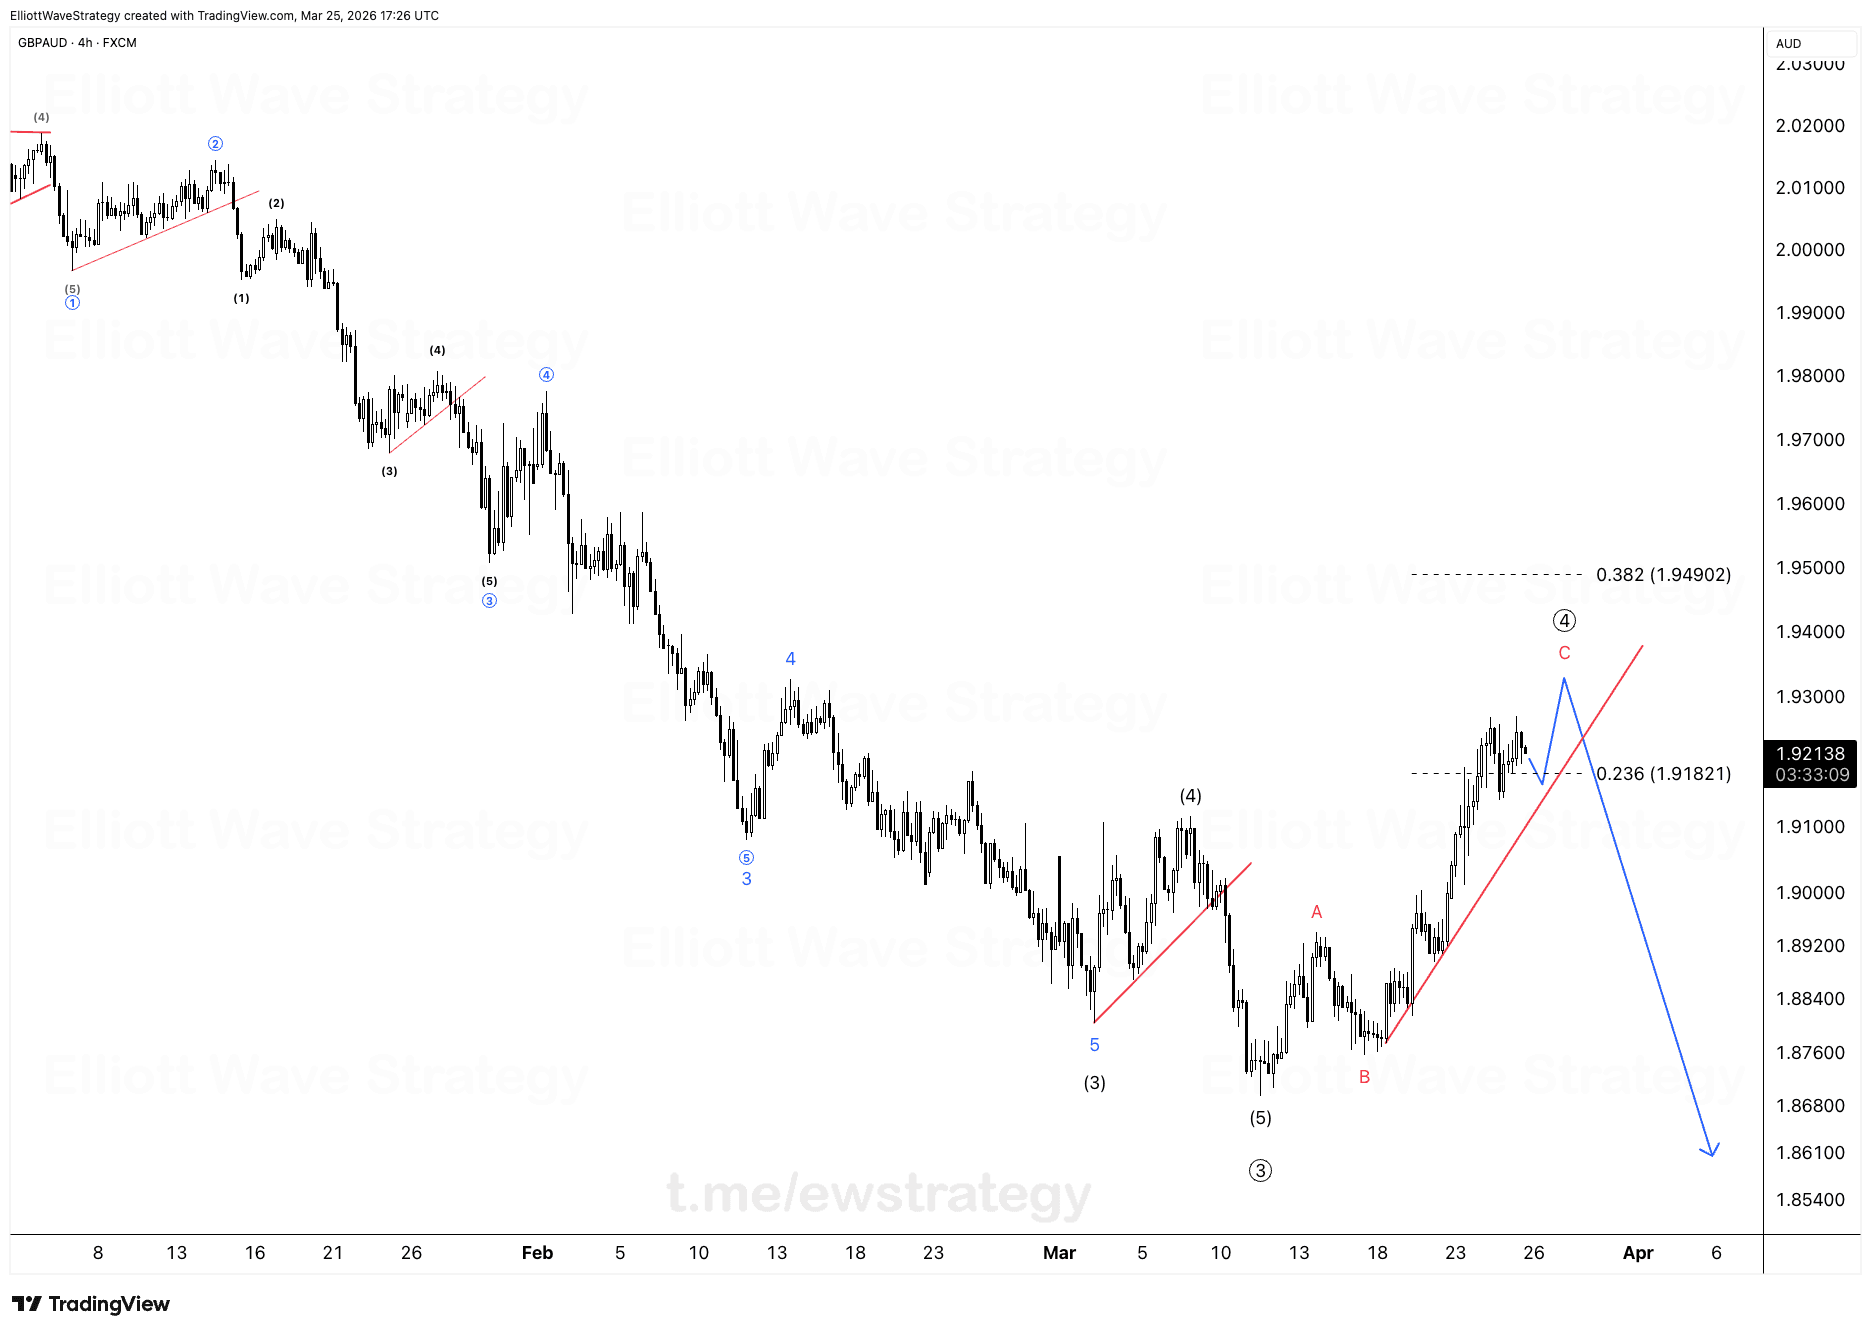
Look at this GBPAUD chart. See that clean ABC correction pattern playing out. This is exactly what separates professional traders from amateurs.
Amateur traders see the bounce from B to C and think it's reversing, time to buy. They panic-enter without understanding the bigger structure. Professional traders see the same bounce and think this is just wave C of the correction, and the bearish trend will resume once this corrective move is complete.
One group trades their emotions. The other trades the wave.
What does the GBPAUD chart actually show right now
The larger picture on the 4H chart is a completed five wave decline from the 2.02000 region down into the 1.85400 area, labeled wave 3 in blue with sub waves 1 through 5 clearly marked. That impulse finished, and price is now correcting that entire move higher.
The correction itself is unfolding as an ABC. Wave A ran up from the 1.87600 low. Wave B pulled back into the 1.87600 zone again. Wave C is now extending higher, and on the chart Cetin projects it toward the 1.94902 level, which lines up with the 0.382 Fibonacci retracement of the prior decline.
Why does wave C trick retail traders into buying
ABC corrections are designed to trap retail traders. Wave C often pushes higher to create false hope, collecting buy orders from impatient traders before the real move begins.
That is the psychological trick built into every corrective structure. The move looks strong enough to convince people the downtrend is over. Volume picks up, candles turn green, and momentum traders jump in exactly where the risk is highest.
On this GBPAUD chart, wave C is drawn extending up toward the 0.382 retracement near 1.94902, right around where wave 4 in the earlier blue count also topped out. That kind of overlap is where late buyers usually get trapped.
What happens after the ABC correction completes
Once wave C finishes, Cetin's drawn trajectory shows GBPAUD reversing sharply, with the blue arrow pointing back down toward the 1.86100 area and below, near the 0.236 retracement at 1.91821 acting as an intermediate marker on the way down.
The lesson is simple. Never fight the main trend during a correction. Wait for the correction to complete, then align with the primary direction. Waves win over emotions, always.
How should traders read this structure without guessing tops
The point of labeling A, B, C is not to call the exact top of C. It is to recognize the character of the move. A sharp corrective rally after a five wave decline is not new trend, it is old trend taking a breath.
GBPAUD bulls buying wave C are betting against the larger structure. GBPAUD traders who understand the ABC label know the bigger move down is still the primary expectation once this correction runs its course.
Key Takeaways
- •GBPAUD completed a five wave decline (blue wave 3) before starting the current ABC correction.
- •Wave C on GBPAUD is projected toward the 1.94902 area, matching the 0.382 Fibonacci retracement.
- •Amateur traders mistake wave C strength for a trend reversal and buy into GBPAUD at the worst point.
- •The drawn trajectory on the GBPAUD chart points back down toward 1.86100 once the ABC correction completes.
- •The 1.91821 level, the 0.236 retracement, sits as an intermediate marker within the projected GBPAUD decline.
Frequently Asked Questions
What is the current Elliott Wave count on GBPAUD?
GBPAUD completed a five wave decline labeled wave 3 in blue, and price is now in an ABC corrective rally, with wave C currently extending higher toward the 1.94902 area.
Why do traders buy into wave C on GBPAUD before a drop?
Wave C often looks like a genuine reversal because it pushes price higher with strong momentum, but it is typically the final leg of a correction that traps late buyers before the larger trend resumes.
What would invalidate the bearish GBPAUD outlook?
If GBPAUD pushes decisively beyond the wave C target near 1.94902 and keeps making higher highs instead of reversing, the corrective ABC count would need to be reconsidered.
Disclaimer: This analysis is for educational purposes only and does not constitute financial advice. Elliott Wave analysis involves subjective interpretation. Always do your own research and manage your risk accordingly.
Get Full Coverage for All 27 Instruments
Premium members receive daily wave counts with entry zones, targets and invalidation levels, published daily across all 27 instruments.
View Premium Plans