GBPJPY Elliott Wave: Wave (4) Chop Before Wave 5 Move
When you correctly identify the main trend, trading becomes simple: You track the corrections, wait for them to complete, and execute in the direction of the mo
When you correctly identify the main trend, trading becomes simple. You track the corrections, wait for them to complete, and execute in the direction of the momentum.
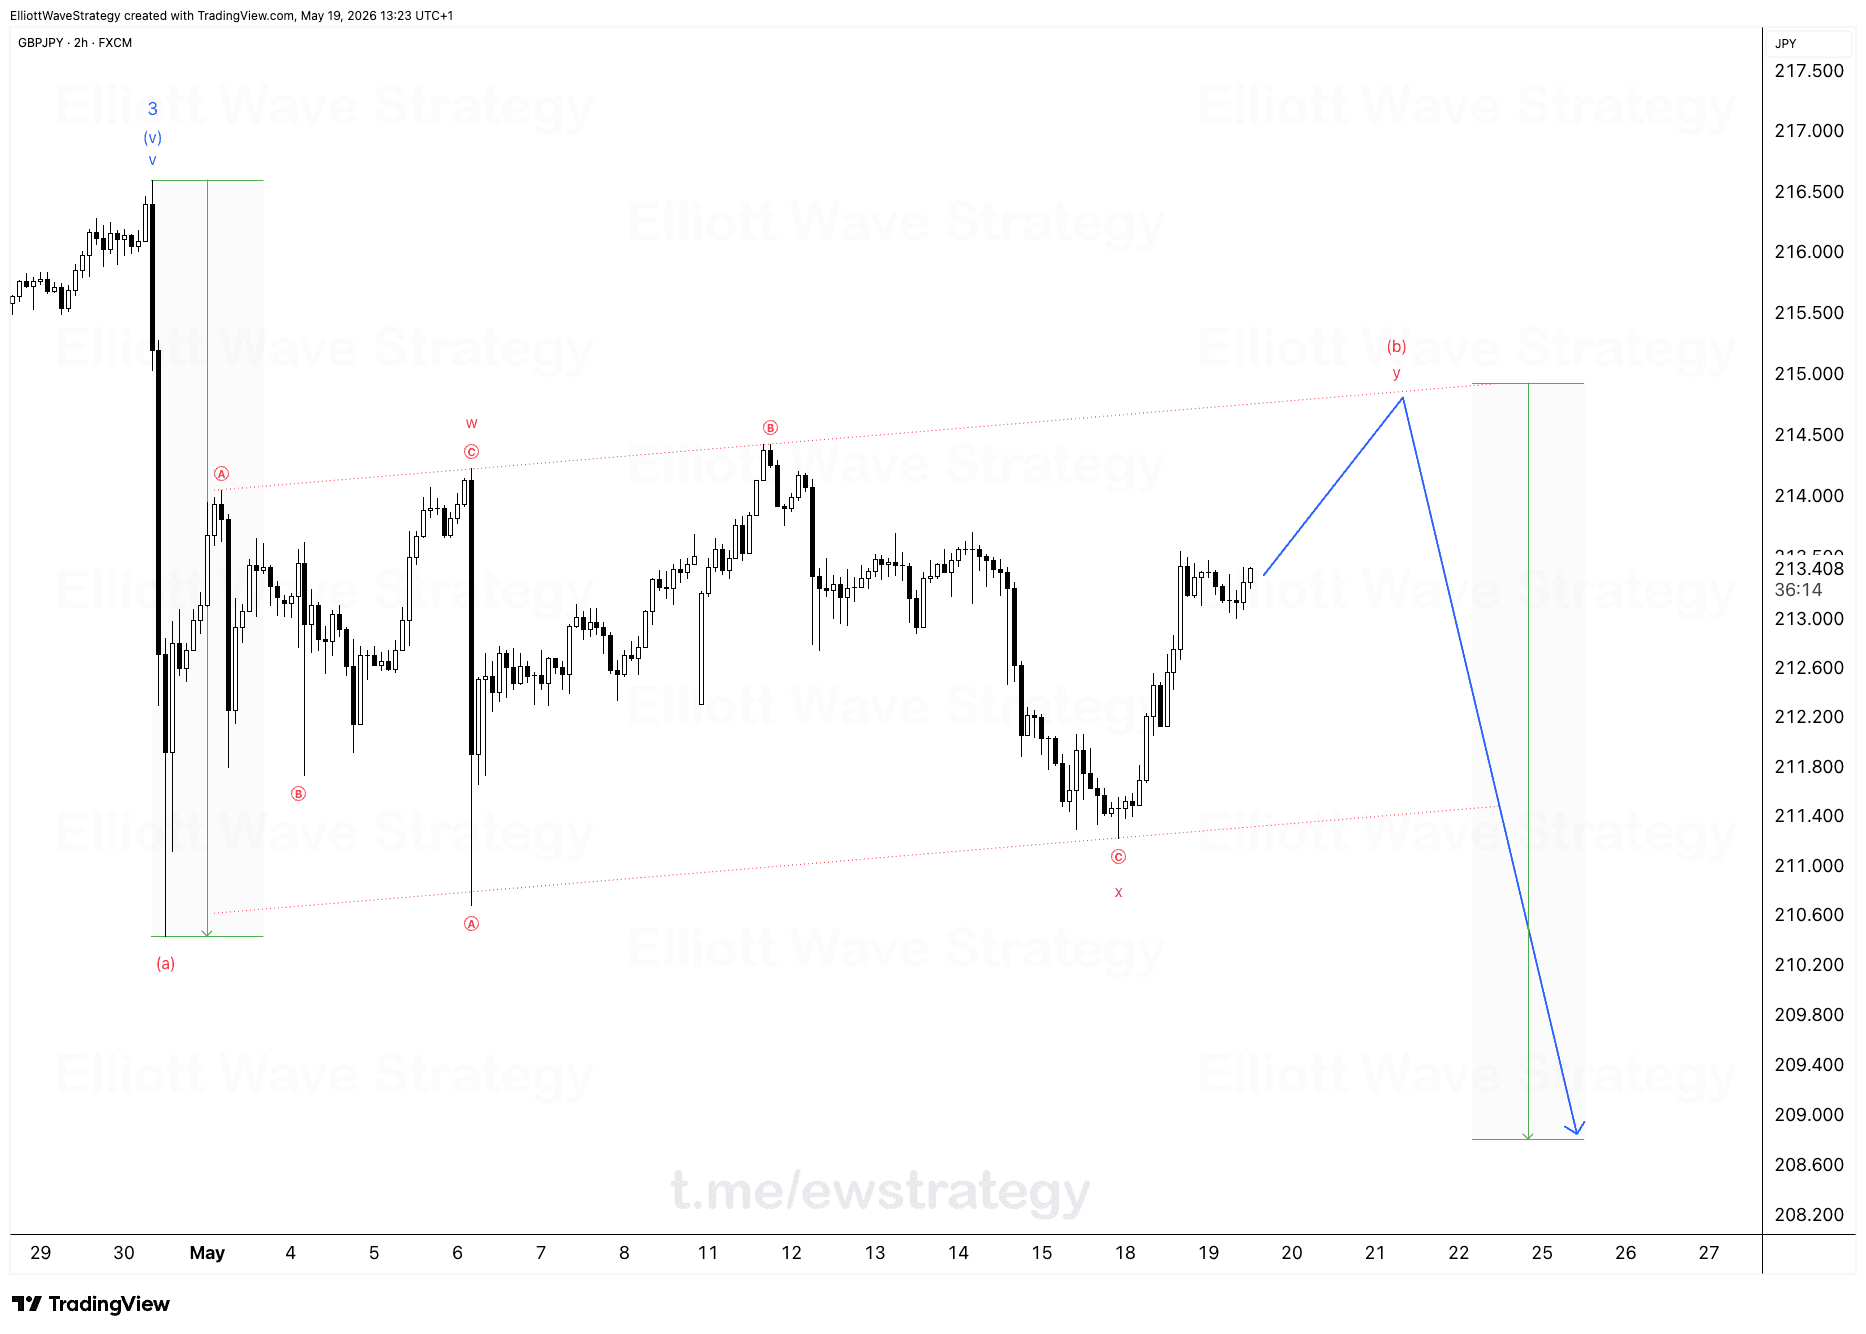
Look at the GBPJPY structure on the 2h chart. The big impulse Wave 3 topped near 216.5, marked by the (v) of v inside that final push. Since then, price has dropped into an (a)-(b)-(c) decline, followed by a w-x-y correction that has been testing patience for weeks. This is Wave (4), and it is a complex one.
Why does GBPJPY look so messy right now
Amateurs see the sideways chop and get frustrated. They force random trades up and down, burning their accounts in the process trying to catch every swing between roughly 210.6 and 214.5.
Professionals see the correction for what it is: preparation for the next major move. The chart shows exactly this kind of structure. Wave A dropped from 216.5 to around 210.6, Wave B rallied back toward 214.0, and Wave C pushed down again to test that same 210.6 zone. Then a second three-wave sequence, labeled w-x-y, built out on top of it. That is textbook complex correction behavior: two corrective legs joined by an x-wave, not a clean single zigzag.
What does Wave (4) mean for the next move
Wave (4) corrections are designed to reset before Wave 5 begins. The rising channel drawn across the chart, connecting the A and C lows on one side and the B and y highs on the other, has contained this entire correction since early May.
Cetin's projection on the chart shows price grinding higher one more time toward the (b) label near 215.0, completing the y leg of this correction. From there, the drawn trajectory turns down sharply toward roughly 209.0, which would mark the actual low of Wave (4) before the next impulse higher can start. That drop below the prior w-x-y lows is what would finally clear the runway for Wave (5).
How should traders handle a correction like this
Major trends do not move in straight lines. They breathe. They correct. They reset before the next expansion, and GBPJPY is doing exactly that inside this multi-week Wave (4).
The job here is not to predict every wiggle inside the correction. It is to stay patient, protect capital, and be ready when the structure gives a genuine signal that Wave (4) has finished and Wave (5) is underway. Chasing every bounce inside a sideways range like this one is how accounts get worn down before the real move even starts.
GBPJPY remains inside a corrective phase, not a trending one. Until price breaks decisively out of the channel and confirms the (b) to Wave (4) low sequence, the chop is the message, not the noise.
Key Takeaways
- •GBPJPY completed Wave 3 near 216.5 and has been inside a complex Wave (4) correction for weeks.
- •The GBPJPY correction shows two joined corrective legs, an A-B-C and a w-x-y, tied together by an x-wave.
- •A rising channel has contained the entire GBPJPY Wave (4) structure since early May.
- •The chart's drawn path shows GBPJPY potentially reaching near 215.0 before turning down toward 209.0 to complete Wave (4).
- •Patience through the GBPJPY correction matters more than trying to trade every swing inside the range.
Frequently Asked Questions
What wave count is GBPJPY currently in?
GBPJPY completed an impulsive Wave 3 near 216.5 and is now inside a complex Wave (4) correction made up of two corrective legs joined by an x-wave.
What would confirm the end of the GBPJPY Wave (4) correction?
A move that breaks decisively below the prior corrective lows, ideally down toward the 209.0 area shown on the chart, would suggest Wave (4) has finished and Wave (5) can begin.
Why does GBPJPY look sideways for so long?
Complex corrections like Wave (4) often combine multiple three-wave patterns, which produces prolonged sideways price action rather than a quick, single pullback.
Disclaimer: This analysis is for educational purposes only and does not constitute financial advice. Elliott Wave analysis involves subjective interpretation. Always do your own research and manage your risk accordingly.
Get Full Coverage for All 27 Instruments
Premium members receive daily wave counts with entry zones, targets and invalidation levels, published daily across all 27 instruments.
View Premium Plans