US100: Daily 200 EMA and Wave Count Agree on the Low
US100 fell for weeks straight into wave v of (c), reaching the zone where two structural signals lined up.
US100 fell for weeks straight into wave v of (c). While it was falling, two things were lining up at the same time, and most traders watching the candles alone never saw it.
The Daily 200 EMA said stop. The wave count said the same thing at the same time. Wave (c) of Y completing right into that dynamic support isn't a coincidence.
One signal alone is noise. A moving average touch by itself means nothing. A wave count finishing by itself means nothing. Two independent signals agreeing on the same zone is where the reversal gets built.
Why does the Daily 200 EMA matter here
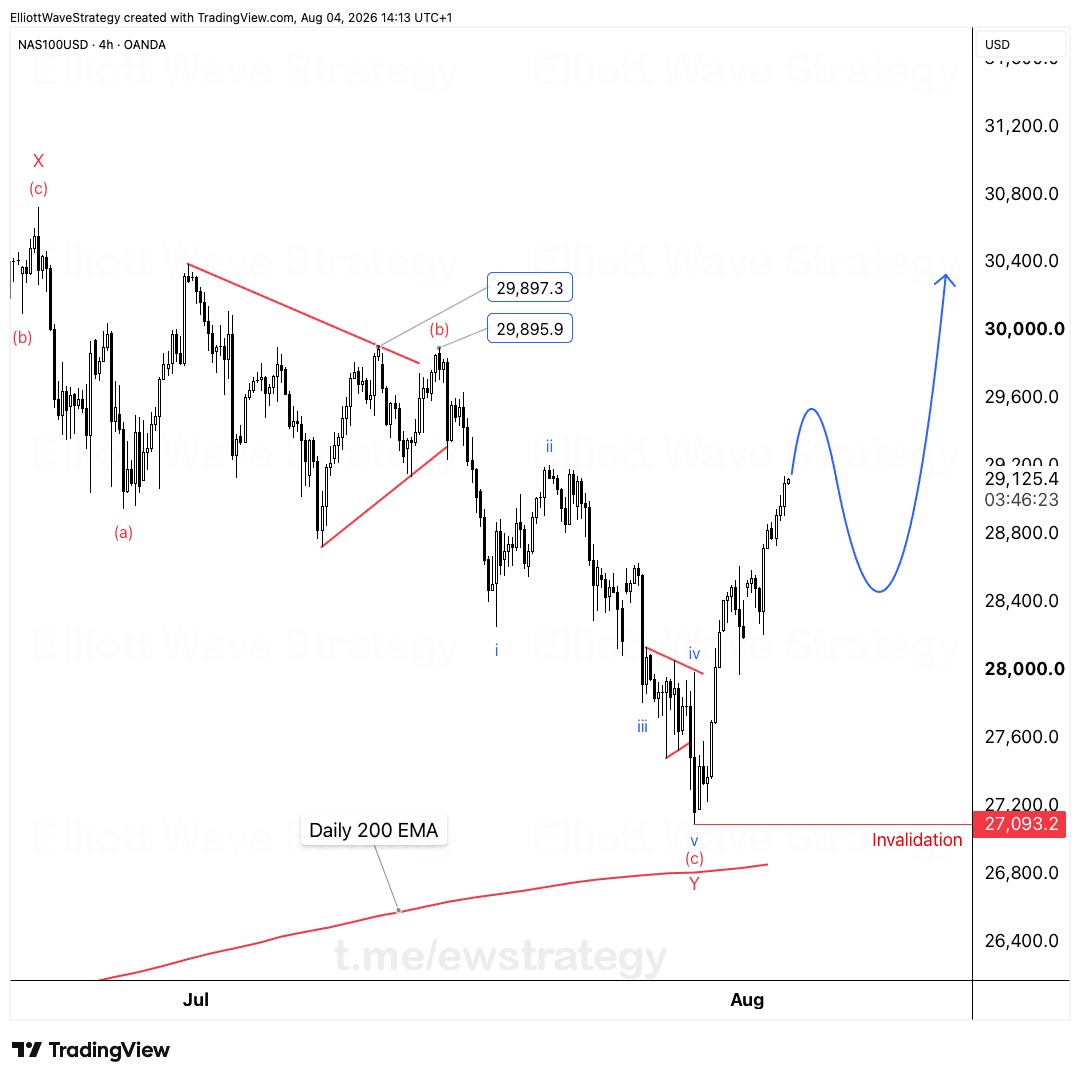
The chart shows the EMA rising gently underneath price for months, climbing from the July lows into August. By the time price dropped into the wave (c) of Y low near 27,093, the EMA had risen up to meet it almost exactly where the decline ran out of room.
That's not a level anyone drew in hindsight. It was already there, tracking upward, waiting.
What does the wave count say about wave (c) of Y
Zoom out on this chart and the whole decline from the (b) high near 29,897 is labeled as a five-wave impulse into wave (c). Inside that impulse, wave i, ii, iii, and iv are all marked before the final wave v low.
Wave (c) of Y is the terminal leg of a larger correction. When a five-wave decline like this completes right at a rising 200 EMA, the location and the structure are telling the same story from two different angles.
What's happening in the impulse up from the low
The move off that low is already tracing its own i-ii-iii-iv-v on the 4H chart. Wave iv found support right where a wave 4 should, above the wave i high, no overlap, structure intact.
That's not decoration. A wave 4 holding above wave 1 is one of the basic rules of impulse structure, and here it held exactly where it needed to. Price then pushed into a new wave v, extending the impulse higher.
The blue projection on the chart shows Cetin's expected path from here: a pullback after this impulse completes, then a resumption higher toward the 30,000 region and beyond. The invalidation for the broader bullish case sits at 27,093.2, the wave v low itself. A break below that level would undercut the entire premise that the low is in.
What this means for reading NAS100 right now
NAS100 is turning. Not because of hope, and not because one indicator flashed a signal. The Daily 200 EMA and the wave count both pointed at the same floor, independently, and price respected it.
When structure and location agree twice in the same chart, once at the (c) of Y low and again at the wave iv low above wave i, that's the kind of confluence worth paying attention to. The 4H impulse is still building, and the next test is whether wave v extends cleanly before any pullback begins.
Key Takeaways
- •US100 completed wave (c) of Y right at the Daily 200 EMA, aligning structure with dynamic support.
- •The 4H impulse up from the low is tracing i-ii-iii-iv-v, with wave iv holding above the wave i high as expected.
- •Invalidation for the bullish US100 case sits at 27,093.2, the wave v low.
- •NAS100's reversal case rests on two independent signals, the EMA and the wave count, agreeing on the same zone.
- •The projected path for US100 points toward the 30,000 region after the current impulse and a following pullback complete.
Frequently Asked Questions
What invalidates the bullish US100 wave count?
A break below 27,093.2, the wave v low of (c), would invalidate the current bullish structure on this US100 chart.
Why does the Daily 200 EMA matter for this US100 setup?
The EMA had risen to meet price almost exactly where the five-wave decline into wave (c) of Y completed, giving the structural low independent confirmation from a dynamic support level.
What stage is the US100 impulse up currently in?
The 4H chart shows an impulse tracing i-ii-iii-iv-v, with wave iv already holding above the wave i high and price pushing into a new wave v.
Disclaimer: This analysis is for educational purposes only and does not constitute financial advice. Elliott Wave analysis involves subjective interpretation. Always do your own research and manage your risk accordingly.
Get Full Coverage for All 27 Instruments
Premium members receive daily wave counts with entry zones, targets and invalidation levels, published daily across all 27 instruments.
View Premium Plans