USDCAD Elliott Wave: Triangle in Wave 4 Before Breakout
We love triangles. Not because they're pretty, but because they stack the odds in our favor.
We love triangles. Not because they're pretty, but because they stack the odds in our favor.
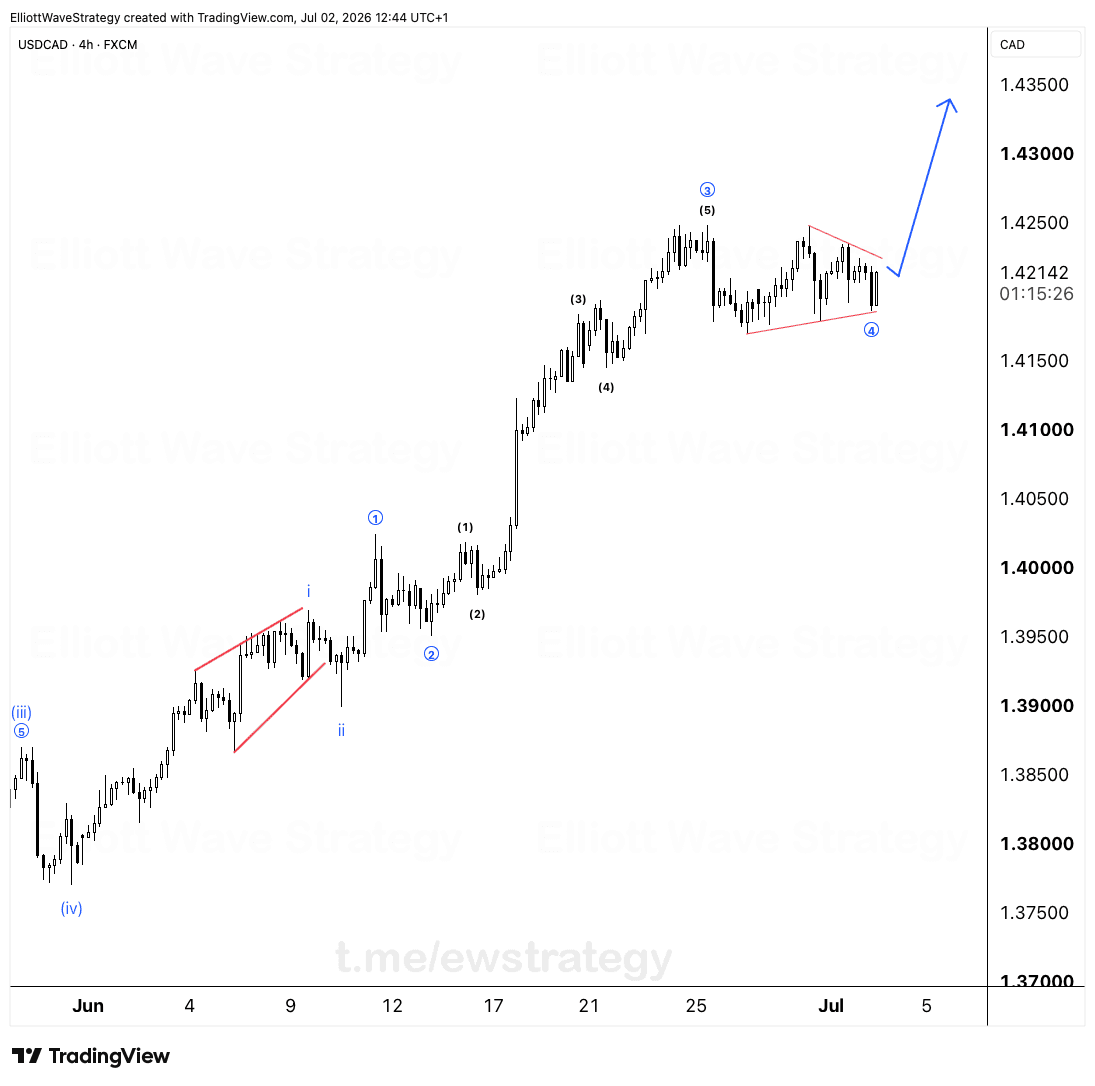
USDCAD just finished wave (5) of the larger impulse at the top, marked as wave 3 on the higher degree count. That rally came in five clean sub-waves from wave (1) through wave (5), and now price has turned sideways instead of dropping into a normal correction. Sideways after a strong impulse usually means one thing: a triangle is forming.
Why does USDCAD look like it's building a triangle in wave 4
Look at the price action since the wave 3 top. It's not falling apart, it's grinding between two converging trendlines drawn in red on the chart. That's a contracting triangle, and it's sitting exactly where wave 4 should sit on this count.
Four clean touches on the trendlines so far, and the range is tightening with every swing. That contraction is the signature of a triangle. Each leg gets smaller than the last, and the boundaries squeeze price into a corner until it has nowhere left to go but out.
This isn't the first time this pair has shown this kind of behavior. Look back at the smaller triangle that formed in wave ii before wave (iii) launched. Same idea, smaller degree. USDCAD has a habit of pausing this way before its bigger impulsive moves.
What happens after wave 4 finishes inside the triangle
Triangles are one of the highest probability patterns to trade because of what comes after them. They almost always resolve with a sharp, fast move in the direction of the prior trend. That means once this wave ④ triangle completes its final leg, the structure calls for a fresh impulsive push higher, the move labeled with the blue arrow on the chart projecting well above 1.43000.
Trading isn't about certainty, it's about probability. A triangle in wave 4 doesn't guarantee the next leg up, but it puts the odds heavily in favor of one once the pattern completes.
How do you trade the chop without guessing the bottom
The temptation inside a triangle is to pick a bottom on every touch of the lower trendline. That's a losing habit. The better approach is watching the boundaries, not guessing where the final low lands.
Each swing inside the triangle narrows the range. That narrowing is the tell. When the price runs out of room between the converging lines, that's when the breakout tends to fire, and it tends to fire hard because the triangle has been compressing energy the whole time it built.
Sit through the chop. That's what pays for the breakout. The wave 4 triangle on USDCAD is still completing its final internal leg, and until it does, patience with the boundaries beats trying to call the exact low.
Final thoughts
USDCAD's structure since the wave (4) low has been a textbook five wave impulse into a wave 3 top, followed by sideways compression that fits a contracting triangle for wave 4. The pattern isn't finished yet, but the tightening range and four clean trendline touches back the count. Once the triangle resolves, the Elliott Wave structure favors a fresh push higher for USDCAD.
Key Takeaways
- •USDCAD completed a five wave impulse into wave 3, with wave (5) marking the top of that move.
- •USDCAD is now building a contracting triangle for wave 4, shown by four trendline touches that keep tightening.
- •Contracting triangles are high probability patterns that typically resolve with a sharp move in the prior trend's direction.
- •Once wave 4 completes its final leg, the Elliott Wave count for USDCAD calls for a fresh impulsive push higher.
- •The trade approach here is watching the triangle boundaries rather than guessing where the final low forms.
Frequently Asked Questions
What does a contracting triangle in wave 4 mean for USDCAD?
It means USDCAD is pausing and consolidating after completing its wave 3 impulse, with price compressing between converging trendlines before a fresh impulsive move higher.
How many touches confirm the USDCAD triangle pattern?
The chart shows four clean touches on the triangle's trendlines so far, with the range tightening on each swing, which is typical triangle behavior.
What invalidates the bullish USDCAD triangle count?
A break and close well outside the triangle's boundaries in the opposite direction of the expected wave 4 completion would call the current count into question.
Disclaimer: This analysis is for educational purposes only and does not constitute financial advice. Elliott Wave analysis involves subjective interpretation. Always do your own research and manage your risk accordingly.
Get Full Coverage for All 27 Instruments
Premium members receive daily wave counts with entry zones, targets and invalidation levels, published daily across all 27 instruments.
View Premium Plans