USOIL Elliott Wave: Triangle E Leg Ignores Iran Headlines
WTI gapped to $100. Brent crossed $105. Trump called Iran's response "totally unacceptable." Netanyahu said the war is not over. Hormuz remains closed.
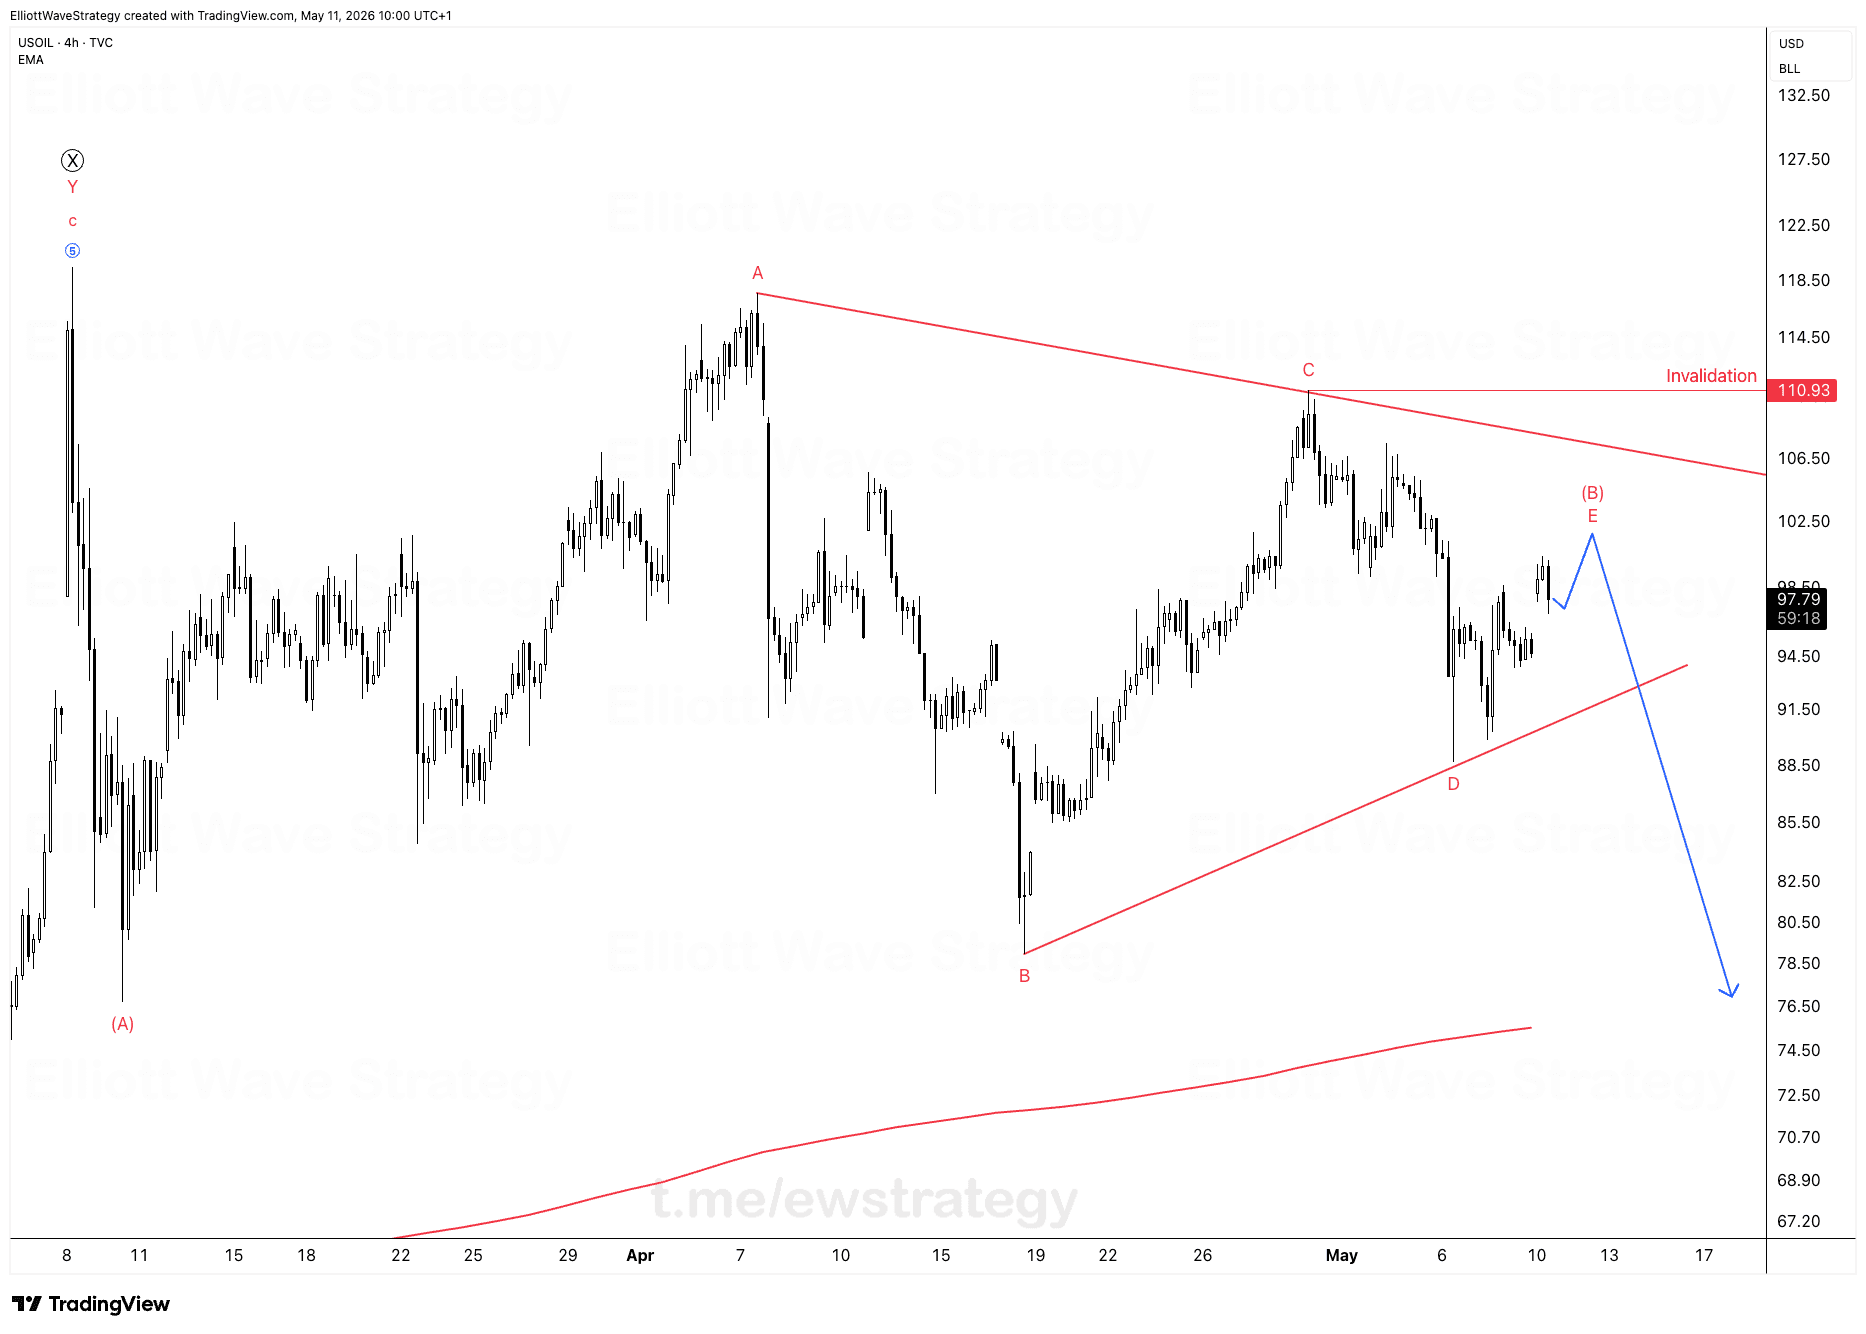
WTI gapped to $100. Brent crossed $105. Trump called Iran's response "totally unacceptable." Netanyahu said the war is not over. Hormuz remains closed. None of that changes the count on the 4H chart.
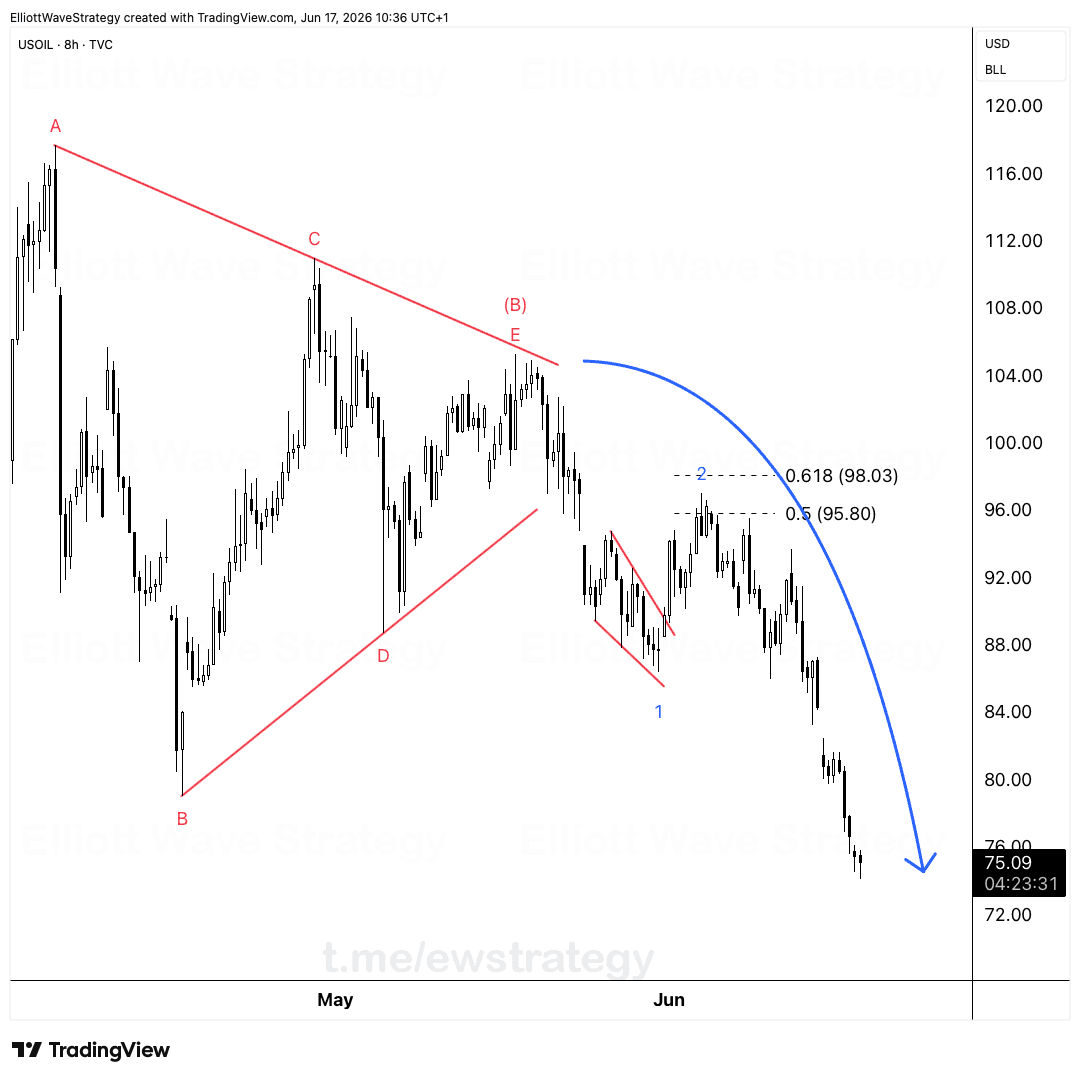
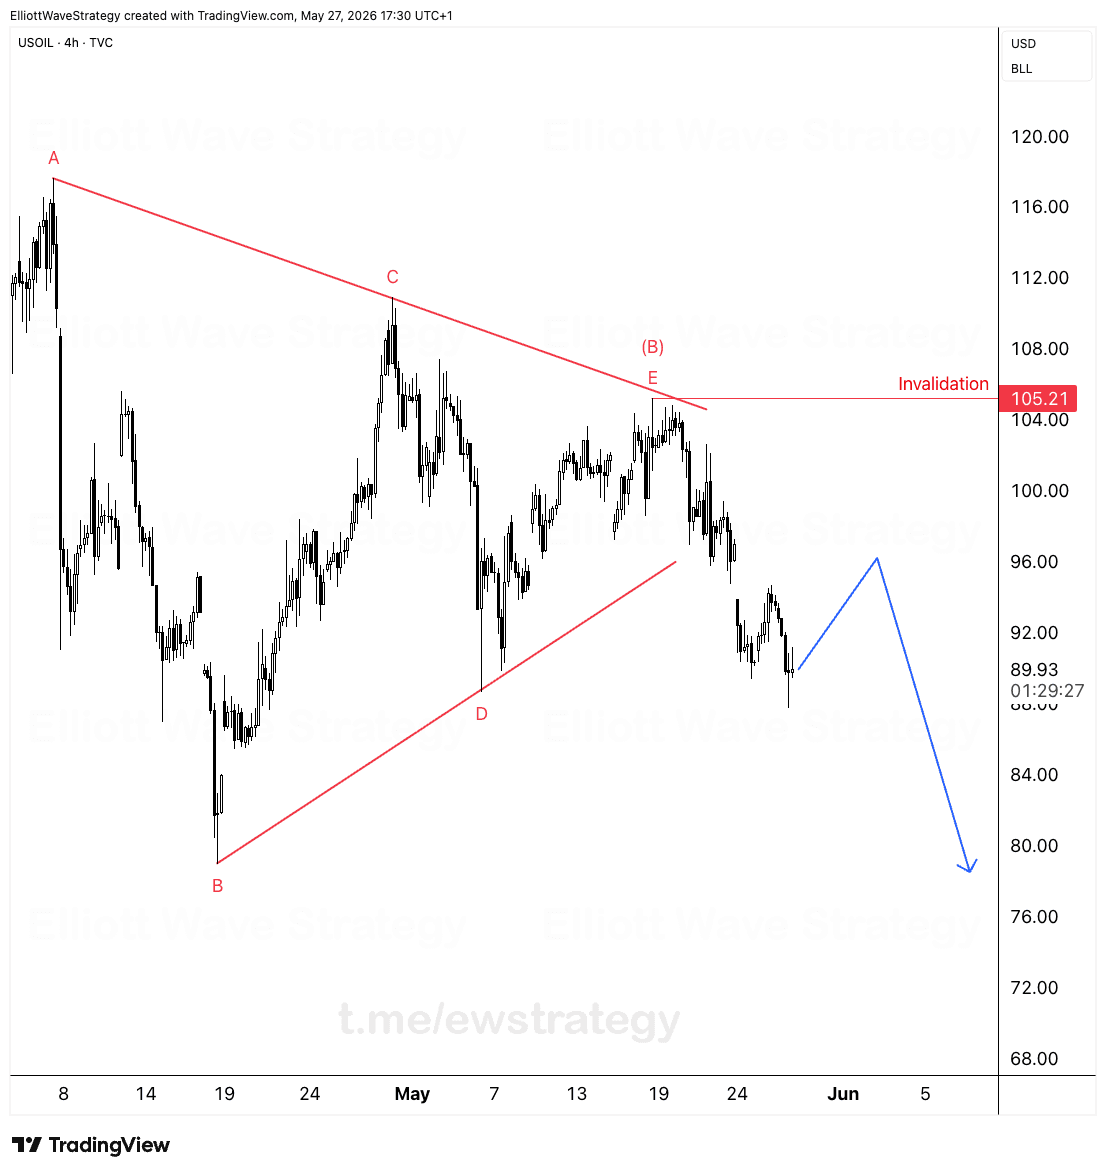
The contracting triangle is still valid. A, B, C, D are in place and labeled on the chart. This sharp spike higher looks like the E leg arriving, and it happens to be arriving with the loudest headlines of the entire move.
That is not a coincidence. Triangles behave this way more often than not. The final leg tends to show up right when the news feels most urgent, not at the start of a new trend. Traders who react to the headline instead of the structure end up buying exactly where the corrective pattern is designed to trap them.
Why does the triangle count still hold above $100
The triangle on USOIL is built from five legs: A down, B up, C down, D up, and now E. Each leg has been overlapping the last, which is the defining feature of a contracting triangle. Wave C topped near 110, wave D bottomed below 85, and the current rally toward the upper trendline fits the E leg completing the pattern.
The invalidation for this bearish plan sits at 110.93. That level is not arbitrary. It is where wave C topped, and a triangle's E leg is not supposed to travel beyond the start of wave C in a standard contracting structure. Stay below it and the sequence remains intact. Close above it and the whole count needs a rewrite.
What happens after the E leg completes
If E finishes near the upper trendline of the triangle, the drawn projection points to a sharp decline afterward, the kind of move triangles typically produce once the fourth or B-wave pattern finishes. Triangles are continuation patterns in Elliott Wave terms, meaning the thrust that follows tends to be fast and directional.
That is why this setup is not about predicting the next headline out of the Middle East. It is about waiting for the market to finish what the structure has already been building since the first leg down.
What confirmation is needed before trusting the bearish plan
Two signals matter here, nothing else. A rejection at the upper trendline of the triangle, or a break of the lower trendline that had been supporting price since wave B. Either one adds weight to the idea that E is done and the next leg down is starting.
Until one of those two things happens, the E leg can keep stretching higher inside the news-driven volatility. Chasing the gap without waiting for either signal is speculation, not structure reading.
Structure over headlines
Amateur traders are panic-buying the gap because the headlines say war, blockade, and unacceptable. Professional traders are watching the triangle finish exactly where the pattern said it might, near the top of a five-year price range that has been building since March.
The news will keep being loud. The structure does not care. As long as USOIL holds under 110.93, the bearish plan for after wave E stays on the table.
Key Takeaways
- •USOIL's 4H chart shows a contracting triangle with A, B, C, D complete and E potentially unfolding into the Iran-driven gap.
- •The invalidation level for the bearish USOIL count sits at 110.93, the high of wave C.
- •A rejection at the triangle's upper trendline or a break of the lower trendline are the two confirmations needed before trusting the next leg down.
- •Triangle patterns often complete their final leg during the loudest news, which is what USOIL is showing right now.
- •If wave E completes as mapped, the projection points to a sharp decline in USOIL following the pattern.
Frequently Asked Questions
What invalidates the bearish USOIL Elliott Wave count?
A close above 110.93, the high of wave C in the triangle, would invalidate the current bearish plan and require a fresh read of the structure.
Why would USOIL rally on bad news if the count is bearish?
Contracting triangles often complete their final E leg during the most dramatic news of the corrective phase, which can create a sharp spike that looks bullish but is actually the pattern finishing.
What confirms that USOIL's E wave is complete?
A rejection at the triangle's upper trendline or a break below the lower trendline are the two signals used to confirm the E leg has finished before expecting the next decline.
Disclaimer: This analysis is for educational purposes only and does not constitute financial advice. Elliott Wave analysis involves subjective interpretation. Always do your own research and manage your risk accordingly.
Get Full Coverage for All 27 Instruments
Premium members receive daily wave counts with entry zones, targets and invalidation levels, published daily across all 27 instruments.
View Premium Plans