Silver Elliott Wave: Why Wave E Patience Beats Guessing
Trading is not about being right. It's about staying ready.
Trading is not about being right. It's about staying ready.
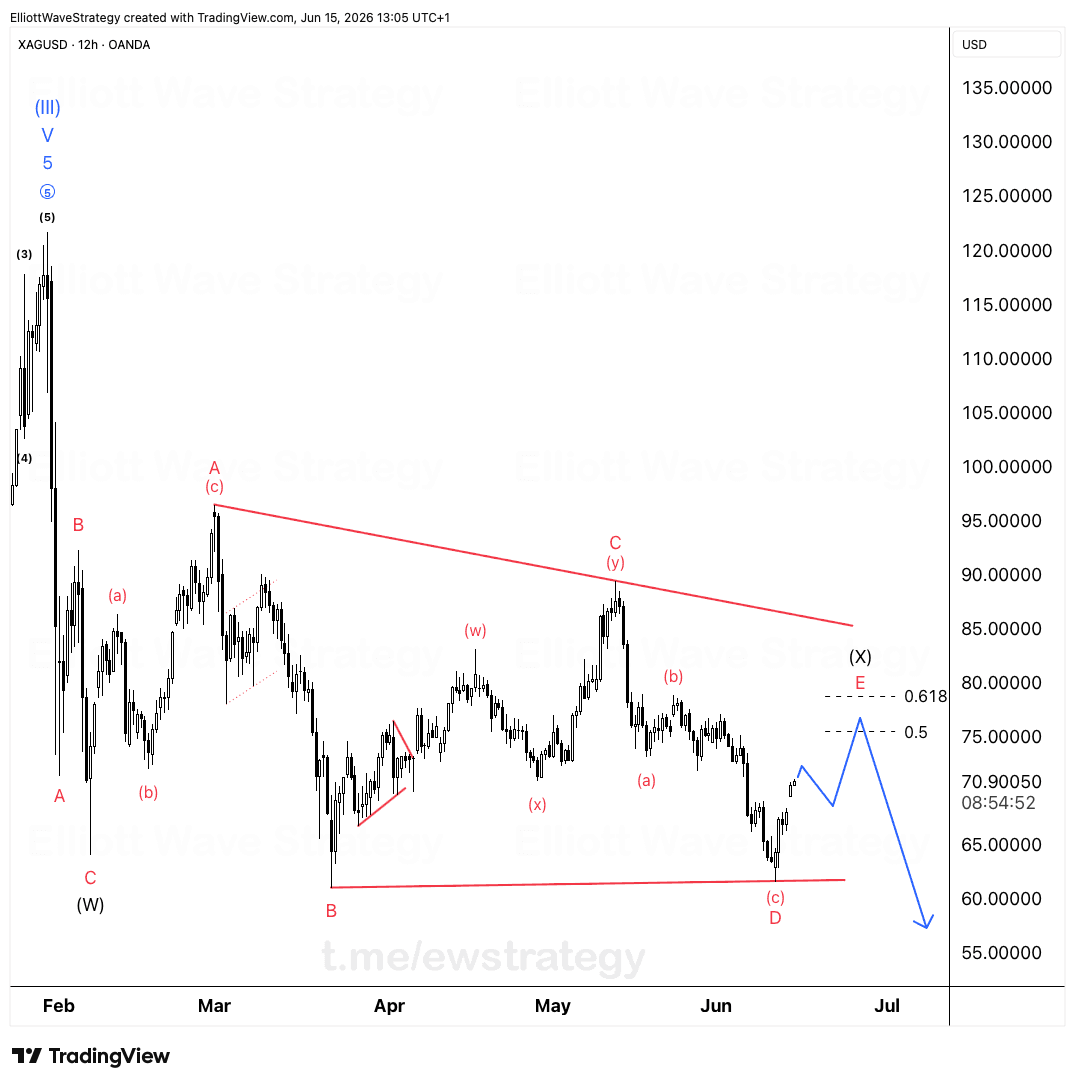
The XAGUSD chart above shows exactly why amateur traders struggle. They see a complex WXY correction and panic. They try to guess where wave E will end. They force trades based on hope instead of structure.
Professional traders see the same chart differently. They see a corrective structure that must complete before the next impulse begins. They see Fibonacci confluence sitting in the 0.5 to 0.618 zone. They see patience paying off while everyone else is guessing.
What does the WXY structure on silver actually show?
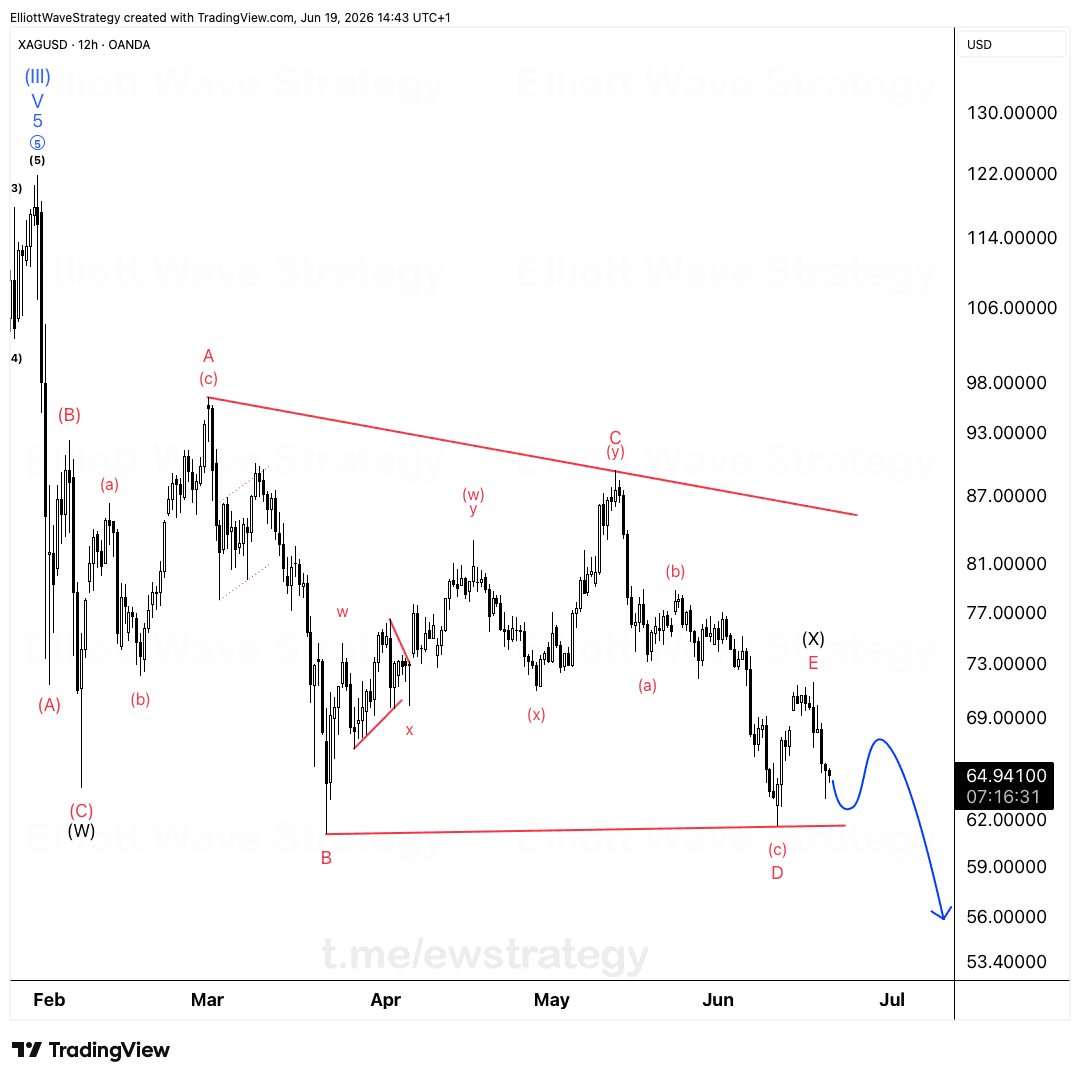
The move down from wave (3) unfolded as a double correction. Wave W completed as a zigzag into the C (W) low, then wave X bounced into wave A near the 95.00 region.
From there wave Y is building as its own zigzag, labeled (a), (b), (c) inside the Y leg. That (c) wave bottomed near the D label on the chart, right where the lower boundary of the descending channel sits.
Now price is carving out what Cetin has marked as wave (X), a triangle unfolding through legs A, B, C, D and now E. Triangles are corrective structures that move sideways in overlapping legs, and they almost always appear in the wave before the final move of a larger pattern, which fits here since this whole thing sits ahead of wave 5 territory.
Why does the 0.5 to 0.618 zone matter for wave E?
The chart marks two horizontal levels, one at the 0.5 retracement and one at the 0.618 retracement, sitting just above the 75.00 to 80.00 area. This is where wave E of the triangle is projected to end based on the drawn trajectory.
Fibonacci confluence inside a triangle's final leg is not a guarantee. It is a zone where professional traders start paying closer attention, because triangle E waves often stall exactly where prior retracement levels line up. Amateur traders skip this step entirely. They just want to know when price goes up.
What happens after wave E completes?
Cetin's drawn path shows price rejecting from the 0.5-0.618 zone and rolling over into a decline that breaks below the D low near 60.00. That would complete the (X) triangle and open the door to the next leg down in the larger corrective sequence.
Until wave E actually prints and reverses, none of this is confirmed. The structure will guide the next step when it's ready, not before.
The mindset shift that separates traders from gamblers
When you accept that corrections are part of the process, you stop fighting the market. You start working with it.
Amateur traders ask when silver will go up. Professional traders ask what will tell them the correction is complete. That question, not a guess about price, is what a triangle count like this one is built to answer.
The wave count on XAGUSD stays incomplete until wave E prints and reverses from the marked zone. Until then, the plan is to watch the structure, not the ticker.
Key Takeaways
- •XAGUSD is tracing a WXY correction with wave Y building as its own zigzag into the (X) triangle.
- •The (X) triangle on XAGUSD is unfolding in legs A, B, C, D, E, with E still incomplete.
- •Fibonacci confluence for wave E sits in the 0.5 to 0.618 retracement zone above the D low.
- •A completed wave E on XAGUSD would set up a decline that could break below the prior D low near 60.00.
- •Professional trading here means waiting for structural confirmation, not guessing where wave E ends.
Frequently Asked Questions
What is the current Elliott Wave count on XAGUSD?
Silver is working through a complex WXY correction, with wave Y forming its own zigzag that leads into a triangle labeled wave (X). That triangle is currently building its final E leg.
Where is wave E of the silver triangle expected to end?
The chart marks Fibonacci confluence between the 0.5 and 0.618 retracement levels, roughly in the 75.00 to 80.00 area, as the zone where wave E could complete.
What invalidates this XAGUSD triangle count?
A triangle count is undermined if price fails to hold the D low near 60.00 before wave E completes, or if the E leg extends well beyond the marked Fibonacci zone instead of reversing there.
Disclaimer: This analysis is for educational purposes only and does not constitute financial advice. Elliott Wave analysis involves subjective interpretation. Always do your own research and manage your risk accordingly.
Get Full Coverage for All 27 Instruments
Premium members receive daily wave counts with entry zones, targets and invalidation levels, published daily across all 27 instruments.
View Premium Plans