XAUUSD: Wave (4) Breaks Down, C Wave Targets 4,300
While amateur traders were predicting tops and bottoms based on feelings, we patiently tracked the structure. The complex Wave (4) consolidation broke down aggressively.
Forcing a bias on gold right now means trading your opinion, not the structure. Patience is the position. You don't trade the chop of a correction, you wait for it to resolve.
The market just showed its hand.
While amateur traders spent weeks guessing tops and bottoms off pure feeling, the structure was tracked patiently. The complex Wave (4) consolidation on XAUUSD has broken down aggressively, and it's executing the C wave drop toward the target zone exactly as the count called for.
What does the XAUUSD chart actually show right now?
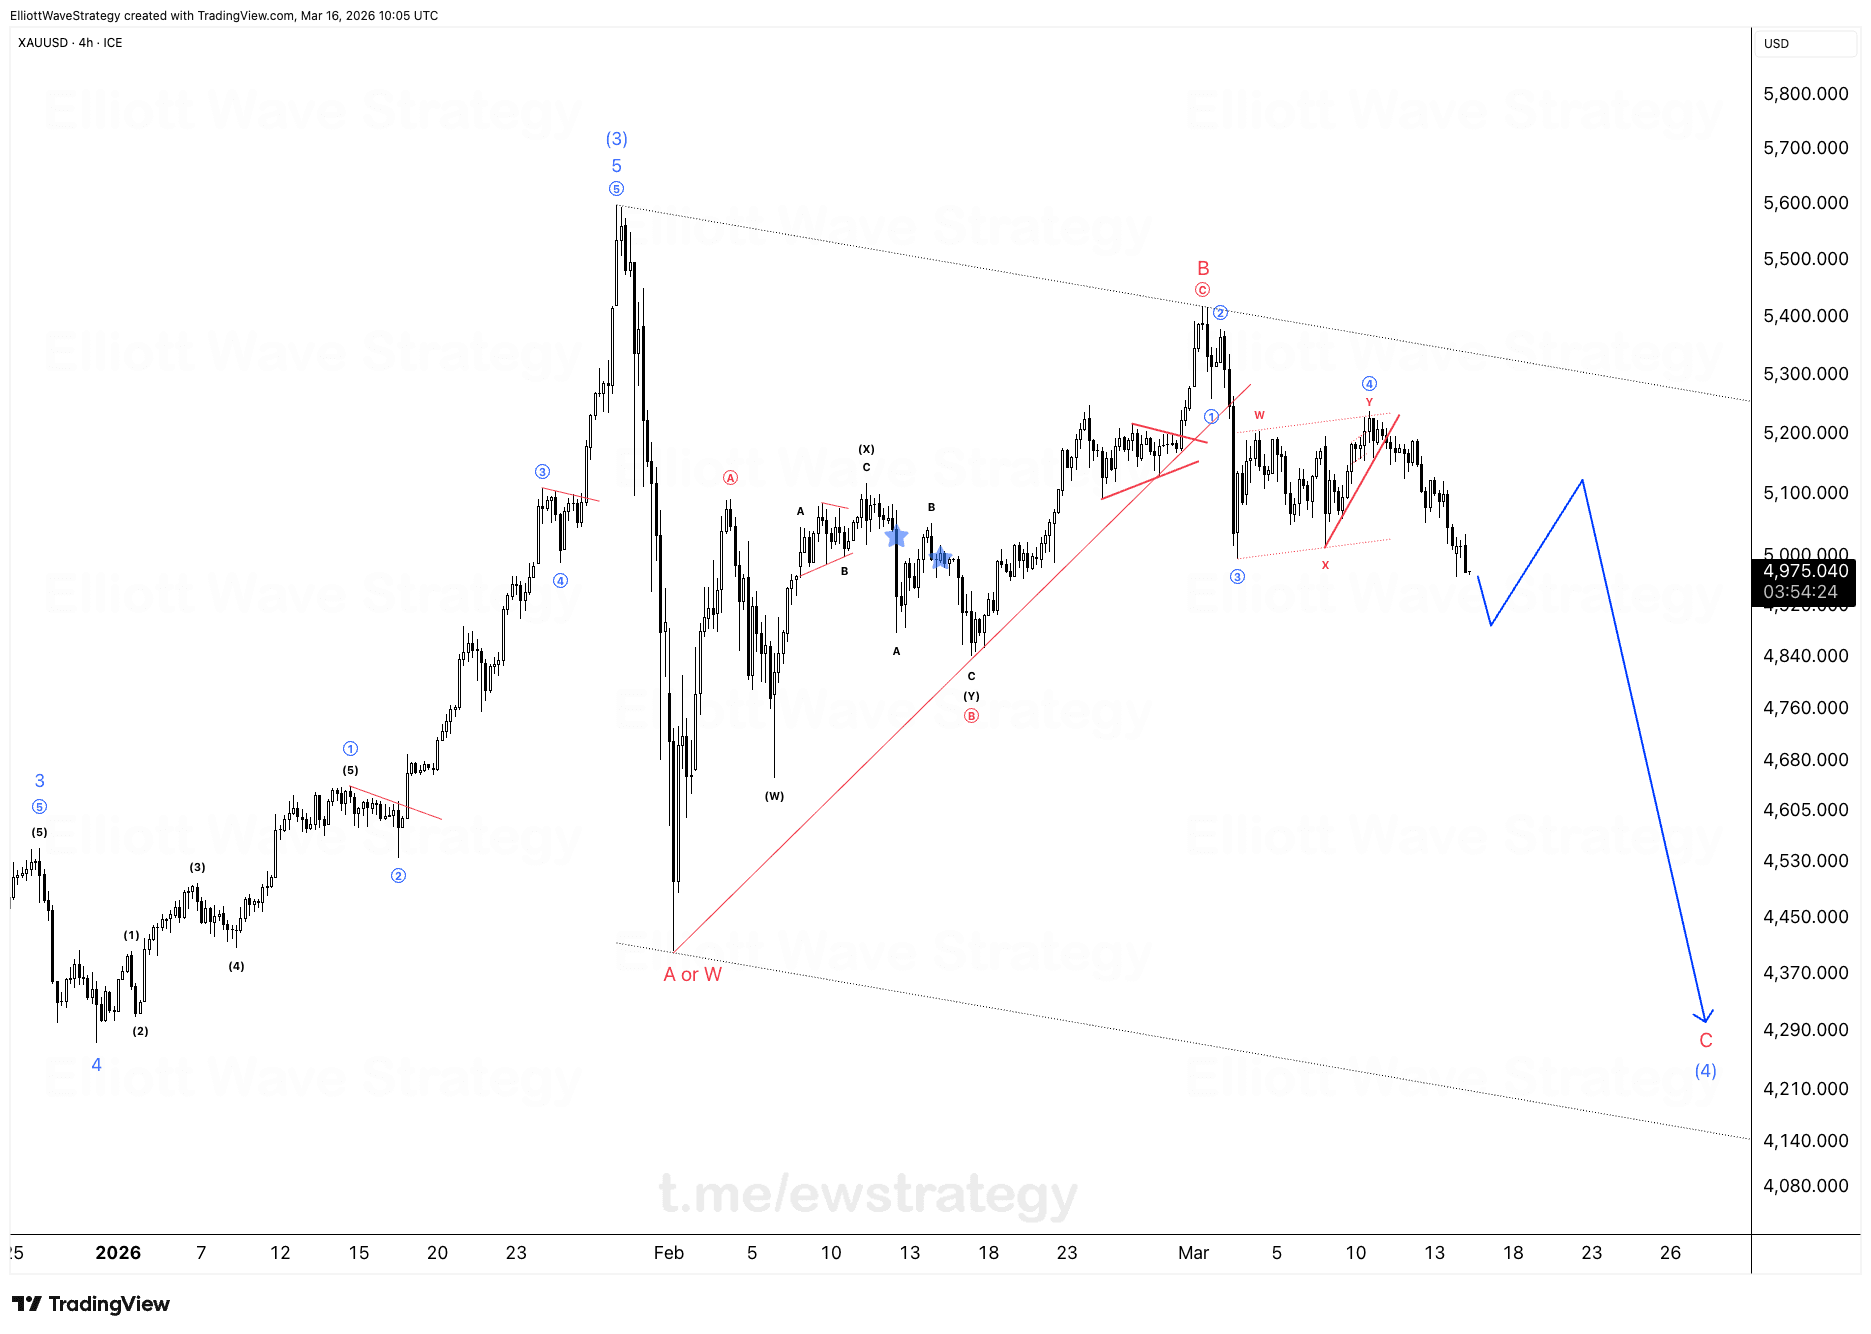
Look at the 4H structure since January. Wave ⑤ topped near 5,600, completing the larger Wave (3) in blue. From there price carved out Wave A or W down into the low 4,400s, then built a long, choppy Wave (4) correction that ran for weeks: an ABC into (X), another ABC into (Y), a contracting triangle in ①, a sharp ② spike to 5,400, and a final ③④ push that topped out near 5,200 before rolling over.
That entire sequence, all those overlapping waves labeled A, B, C, W, X, Y, ①, ②, ③, ④, is one thing: a complex Wave (4) correction. It's messy by design. Corrections are supposed to look confusing. That's exactly why forcing a directional bias inside that mess was a losing game.
Now the price has broken down out of that consolidation. The chart shows a projected C wave decline heading toward the 4,300 area, marked with the blue trajectory on the chart. That's the move the whole (4) structure was building toward.
Why does the complex correction matter for what comes next?
A Wave (4) like this isn't noise, it's information. Every leg inside it, the triangle, the double zigzag pieces, the failed breakout near 5,200, was the market absorbing the prior Wave (3) rally before deciding its next direction.
Once a correction this complex finally breaks its boundary lines, the move that follows tends to be impulsive and fast. That's what's showing up now. The C wave leg down isn't a slow grind, it's aggressive, which is typical once a drawn-out correction finally resolves.
What's the actual trading lesson here?
Having multiple scenarios ready isn't indecision. It's preparation. The whole point of building a bullish case and a bearish case in parallel is that you're not married to either one when the chart is still chopping around inside a Wave (4).
Once the structure breaks, you don't need a prediction anymore, you need execution. If the chart changes, you adjust. If it's still messy, you sit on your hands. That discipline is what separated waiting for this breakdown from guessing at every swing high and low along the way.
Gold's C wave toward 4,300 is the payoff for that patience. The chop is over, and the impulsive phase is what the structure was building toward all along.
Key Takeaways
- •XAUUSD has broken down out of a complex Wave (4) correction that built for weeks on the 4H chart.
- •The Elliott Wave count on XAUUSD projects a C wave decline toward the 4,300 zone.
- •The Wave (4) consolidation included nested ABC, W-X-Y, and triangle structures before resolving.
- •Trading a complex correction directionally before it breaks its boundaries is a common mistake for XAUUSD traders.
- •Once the C wave completes, the structure points toward a fresh impulsive move higher in gold.
Frequently Asked Questions
What is the current Elliott Wave count for XAUUSD?
Gold completed a Wave ⑤ top near 5,600 finishing the larger Wave (3), and has since been building a complex Wave (4) correction that recently broke down into a C wave decline toward roughly 4,300.
Why did XAUUSD chop sideways for so long before dropping?
That sideways action was the internal structure of Wave (4), a correction made up of nested ABC and W-X-Y patterns plus a contracting triangle, which typically produces overlapping, directionless price action until it finally breaks.
What happens after the C wave decline in gold completes?
Once Wave (4) fully resolves with the C wave down, the Elliott Wave structure points to the start of a new impulsive move higher, though the exact timing depends on how the decline unfolds relative to the projected zone.
Disclaimer: This analysis is for educational purposes only and does not constitute financial advice. Elliott Wave analysis involves subjective interpretation. Always do your own research and manage your risk accordingly.
Get Full Coverage for All 27 Instruments
Premium members receive daily wave counts with entry zones, targets and invalidation levels, published daily across all 27 instruments.
View Premium Plans