XAUUSD Elliott Wave: Bears Take Control After Wave 2
In our last update, we showed you the Wave (4) rejection right at the 0.618 Fib on the 4H chart. Now, let's zoom in and look closer at the 1-hour timeframe.
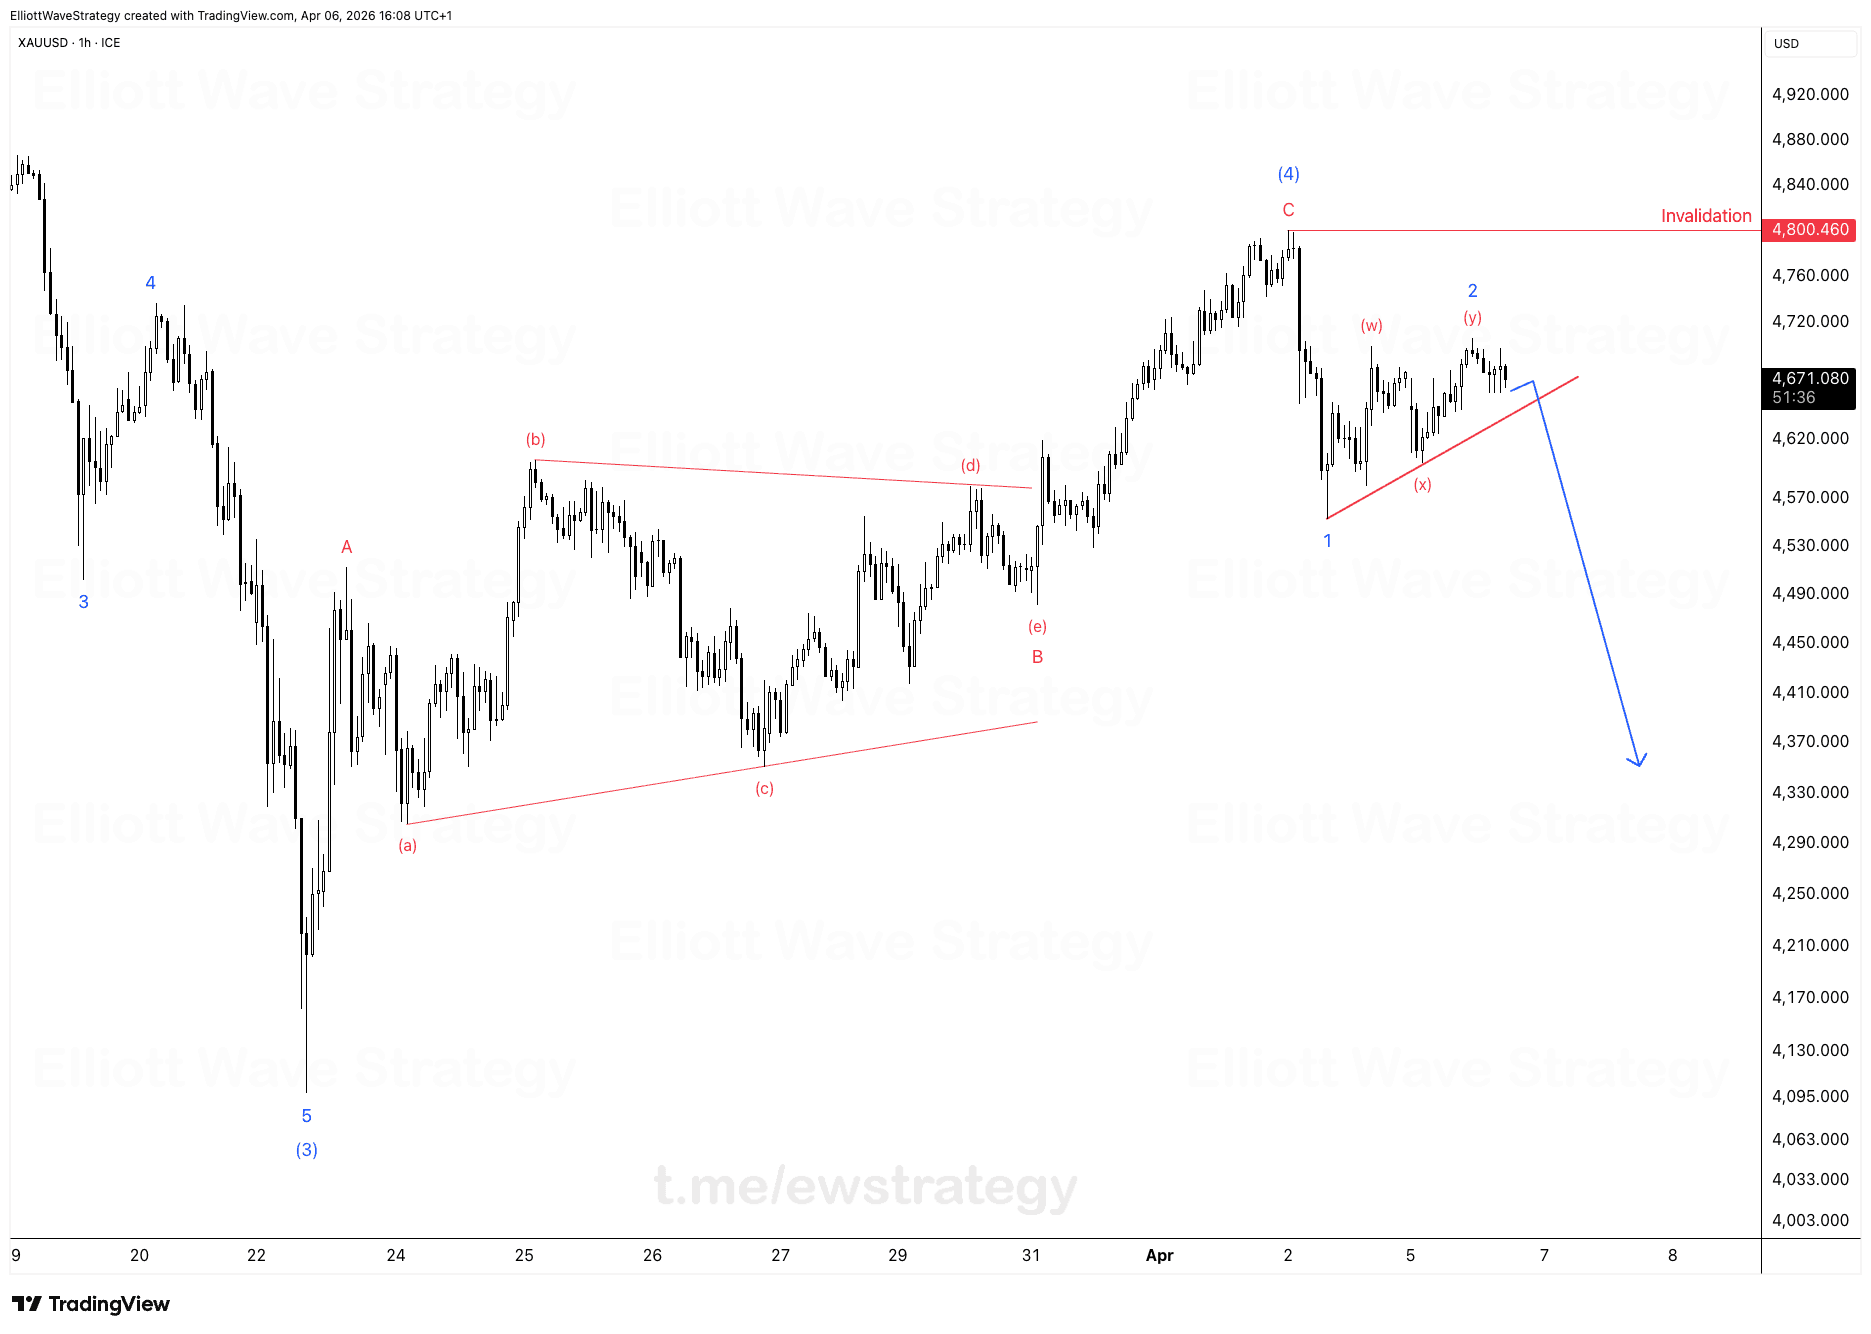
Gold just showed its hand on the 1 hour chart. The moment the first minor correction finished, sellers stepped in immediately. No hesitation, no fake breakout attempt. That is what momentum shifting in real time looks like.
We flagged this setup in the last update on the 4H chart, where XAUUSD rejected hard at the 0.618 Fibonacci retracement inside Wave (4). Zooming into the 1 hour chart now shows the internal structure of that rejection, and it lines up with the bearish plan.
What does the 1H structure show after Wave C at 4,800.46?
The rally into 4,800.46 completed a corrective sequence labeled (w), (x), (y), forming Wave C of the larger Wave (4). From there, price dropped into Wave 1, bounced into a small Wave 2, and that bounce respected the rising trendline drawn off the Wave 1 low.
Wave 2 topped out and reversed almost immediately once it tagged that trendline. That is the tell. Corrections that reverse fast at a drawn boundary usually mean the larger trend, in this case down, is back in charge.
Why does the Wave 2 rejection matter for XAUUSD bears?
A clean Wave 1 down followed by a shallow, fast Wave 2 is a textbook setup for an extended Wave 3 decline. The chart's projected path points sharply lower, well below the 4,570 area where Wave 1 bottomed.
This is exactly why the 4,800.46 level marked on the chart is the invalidation point for the whole bearish case. As long as price stays under that line, the corrective count from Wave (4) into Wave C holds, and the impulsive move down in Waves 1 and 2 keeps developing on schedule.
How does the 4H Wave (4) rejection connect to this 1H count?
The bigger picture never left the room. Wave (4) on the 4H chart rejected precisely at the 0.618 Fib, which is a normal retracement depth for a fourth wave in an extended structure. That rejection at Wave C, the point where price stalled and reversed near 4,800.46, is the same swing high visible on the 1H chart.
Everything downstream on the smaller timeframe, the Wave 1 drop, the Wave 2 bounce off the trendline, is just the lower-timeframe expression of that higher-timeframe turn. When timeframes agree like this, the count carries more weight.
Closing thought
Momentum shifted the second Wave 2 finished correcting. Bears took control at the trendline exactly where the structure said they should. Planning ahead of the move, not reacting to it, is what separates a prepared trader from one chasing candles after the fact.
Key Takeaways
- •XAUUSD rejected the 0.618 Fibonacci retracement at Wave (4) on the 4H chart, forming Wave C near 4,800.46.
- •The 1H chart shows XAUUSD completing Wave 1 down and a shallow Wave 2 bounce that reversed right at the rising trendline.
- •4,800.46 is the invalidation level for the bearish XAUUSD count marked on the chart.
- •A fast, shallow Wave 2 rejection on XAUUSD often precedes an extended Wave 3 move lower.
- •The 4H and 1H XAUUSD counts align, with the same swing high acting as Wave C and the starting point for the current decline.
Frequently Asked Questions
What invalidates the bearish XAUUSD Elliott Wave count?
A move back above 4,800.46, the level marking the top of Wave C and Wave (4), would invalidate the current bearish structure on XAUUSD.
What does the Wave 2 rejection on XAUUSD's 1H chart signal?
The fast reversal at the trendline after Wave 2 suggests bears regained control and that an extended Wave 3 decline may be developing.
How does the 4H and 1H XAUUSD analysis connect?
The Wave C high near 4,800.46 on the 1H chart is the same swing high where Wave (4) rejected the 0.618 Fibonacci retracement on the 4H chart, showing agreement across timeframes.
Disclaimer: This analysis is for educational purposes only and does not constitute financial advice. Elliott Wave analysis involves subjective interpretation. Always do your own research and manage your risk accordingly.
Get Full Coverage for All 27 Instruments
Premium members receive daily wave counts with entry zones, targets and invalidation levels, published daily across all 27 instruments.
View Premium Plans