XAUUSD Elliott Wave: Complex Correction Nears Final Leg
Every correction is a chance.
Every correction is a chance. Most traders get bored when gold goes sideways. They close the chart and look for action elsewhere. That's exactly when the next move gets built.
A correction isn't dead time. It's preparation. The market gathers energy wave by wave until the structure completes, and when it breaks, it moves fast. Right now XAUUSD is sitting in that phase, and the 4H chart shows exactly why.
What does the XAUUSD chart actually show right now
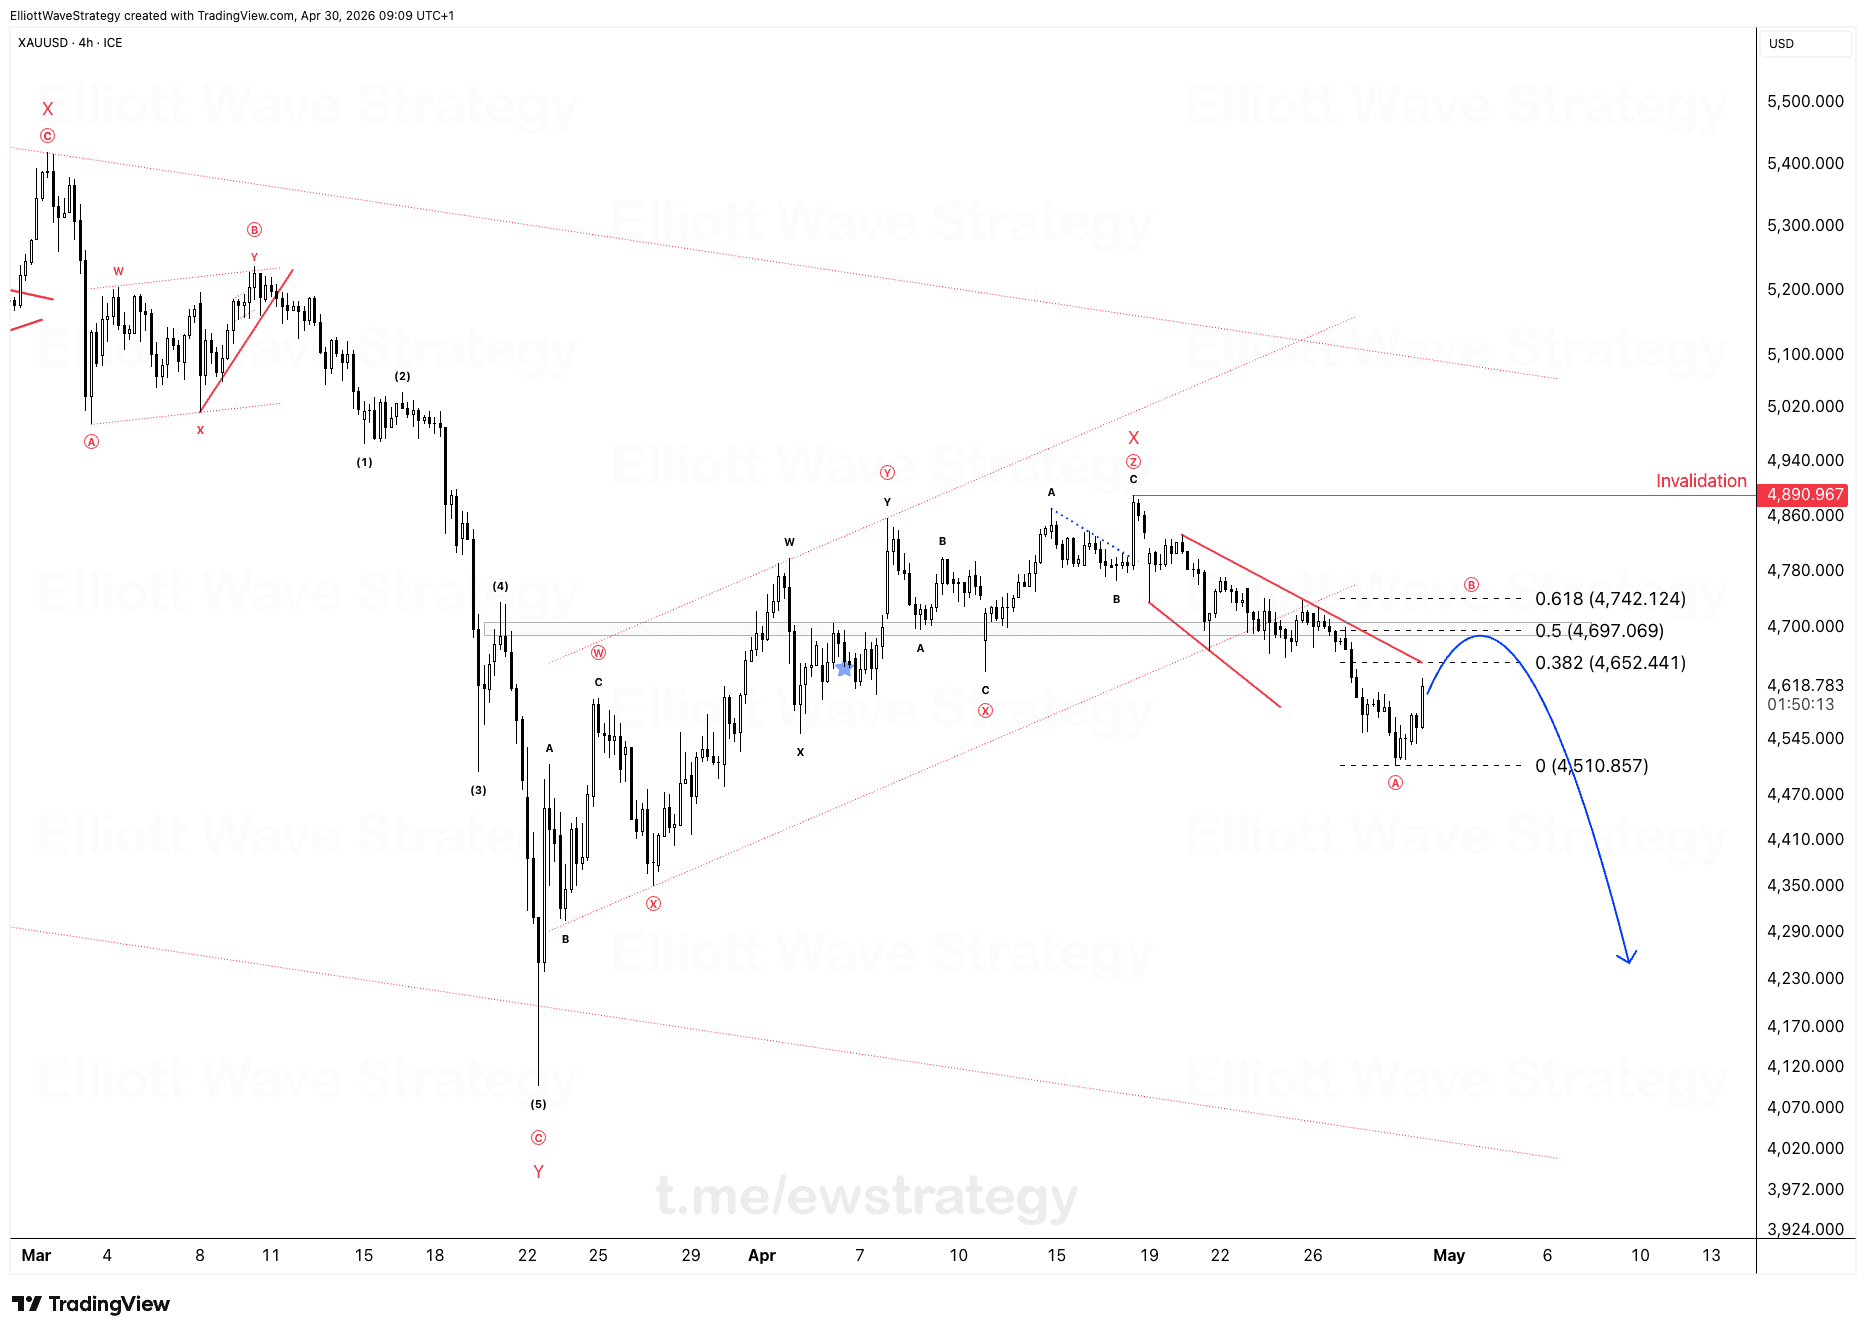
Gold topped out near 5,500 in the (X) wave and has been carving a large corrective sequence since. After the (1) through (5) impulse down into the March low, price built a WXY structure higher into the ⓧ wave, then rolled into another WXYXZ combination.
The current leg is labeled A, B, C off the ⓩ high near 4,890. Wave A dropped into the 4,510 zone, wave B is now retracing that decline, and the Fibonacci grid marks the levels where wave B should find resistance: 0.382 at 4,652.441, 0.5 at 4,697.069, and 0.618 at 4,742.124.
This is a complex correction, several simple corrections joined by connector X waves. That's precisely the kind of structure that convinces impatient traders nothing is happening, right before it resolves.
Why does the invalidation level matter here
The invalidation is marked flat at 4,890.967, the high of the ⓩ wave. As long as XAUUSD stays under that line, the corrective count from the highs remains intact and the drawn path lower stays valid.
A close above 4,890.967 would break the count. Until that happens, every bounce inside the B wave is just the market filling out the pattern, not a reason to abandon the bearish structure.
This is what separates professionals from amateurs during sideways price action. Amateurs see chop and lose interest. Professionals see a coiling spring building toward the next impulsive leg, marked by the blue projection curling down from the B wave toward new lows.
How should traders read the current B wave bounce
The B wave rally off the 4,510 low is unfolding into the resistance band between 4,652 and 4,742. Those Fibonacci levels aren't arbitrary, they're the retracement zones where B waves inside a wave A/B/C decline typically stall.
If price respects this zone and turns down again, that confirms the C wave is next, aiming to extend the decline documented by the drawn trajectory on the chart. The structure has been respecting these levels so far, which is why the count is treated as clear rather than speculative.
Patience during this phase isn't passive. It's the position. Waiting for the plan mapped by the wave count to either confirm or invalidate is the actual discipline, not chasing the boring middle of the correction.
Final thoughts on the gold correction
The complex correction from the highs is carving out its final structure, and the Fibonacci retracement levels are holding where the count says they should. The invalidation at 4,890.967 keeps the risk defined. The rest is watching whether the B wave respects resistance or breaks the plan.
Key Takeaways
- •XAUUSD is completing a complex WXYXZ correction on the 4H chart with invalidation at 4,890.967.
- •The current B wave in XAUUSD is testing Fibonacci resistance at 4,652.441, 4,697.069 and 4,742.124.
- •A move above 4,890.967 would invalidate the current bearish Elliott Wave count for XAUUSD.
- •The drawn projection on the chart points toward a C wave decline below the 4,510 wave A low if resistance holds.
Frequently Asked Questions
What invalidates the current XAUUSD Elliott Wave count?
A confirmed close above 4,890.967, the high of the ⓩ wave, would invalidate the corrective structure currently mapped on the 4H chart.
Why is gold moving sideways right now instead of trending?
The 4H chart shows XAUUSD building a complex WXYXZ correction, a type of structure that naturally produces choppy, range bound price action while it completes.
What are the key Fibonacci levels for the XAUUSD B wave?
The B wave bounce is measured against 0.382 at 4,652.441, 0.5 at 4,697.069, and 0.618 at 4,742.124, the retracement zone where the correction is expected to stall.
Disclaimer: This analysis is for educational purposes only and does not constitute financial advice. Elliott Wave analysis involves subjective interpretation. Always do your own research and manage your risk accordingly.
Get Full Coverage for All 27 Instruments
Premium members receive daily wave counts with entry zones, targets and invalidation levels, published daily across all 27 instruments.
View Premium Plans