BTCUSDT Elliott Wave: Bounce Is Wave (iv), Not a Bottom
The bounce you see is not the bottom. It is wave (iv) of the larger decline.
Bitcoin bounced off the 60k zone and traders are already calling the bottom. Look at the wave count instead. This bounce is wave (iv) of a larger decline, and wave (iv) corrections exist for one reason: to trap the impatient.
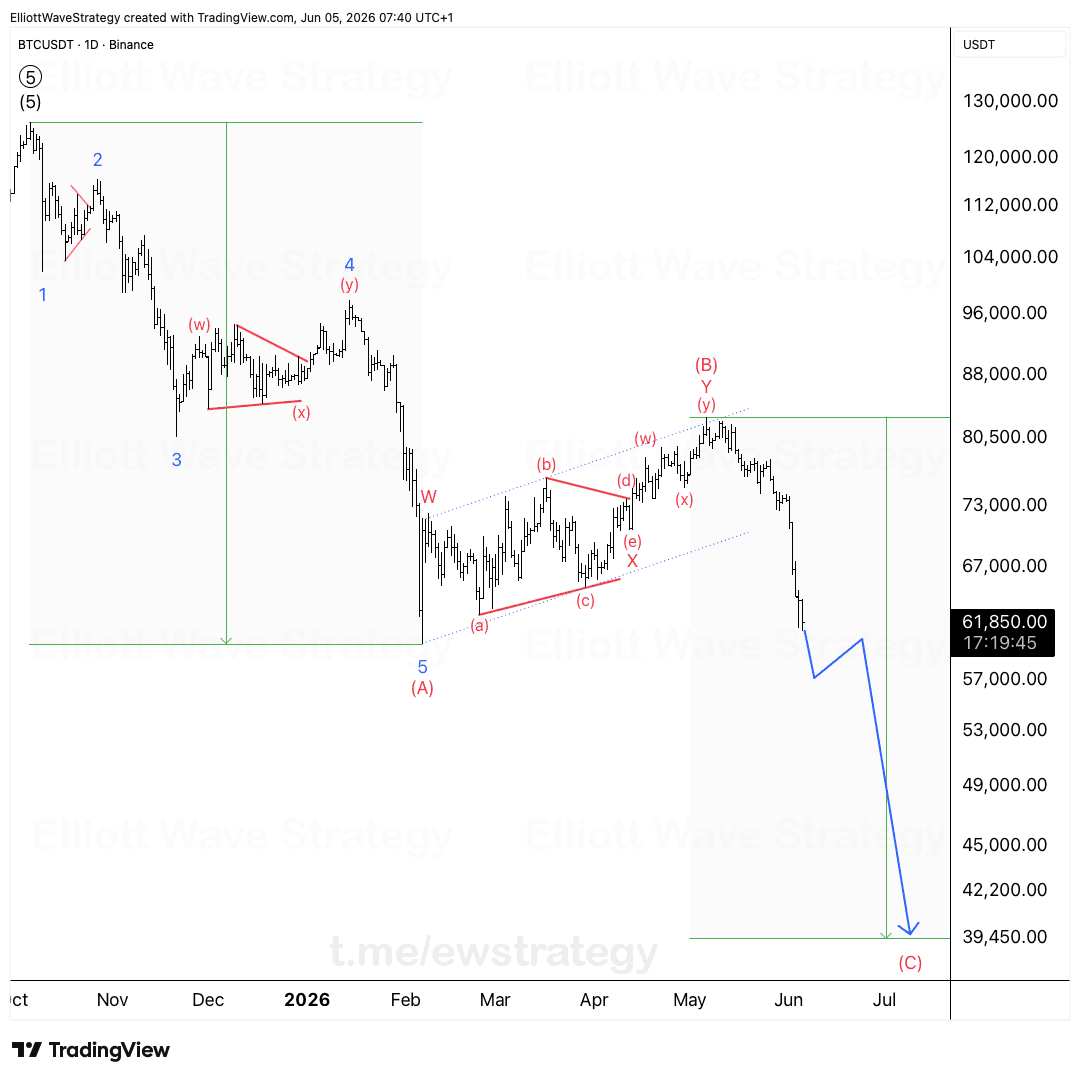
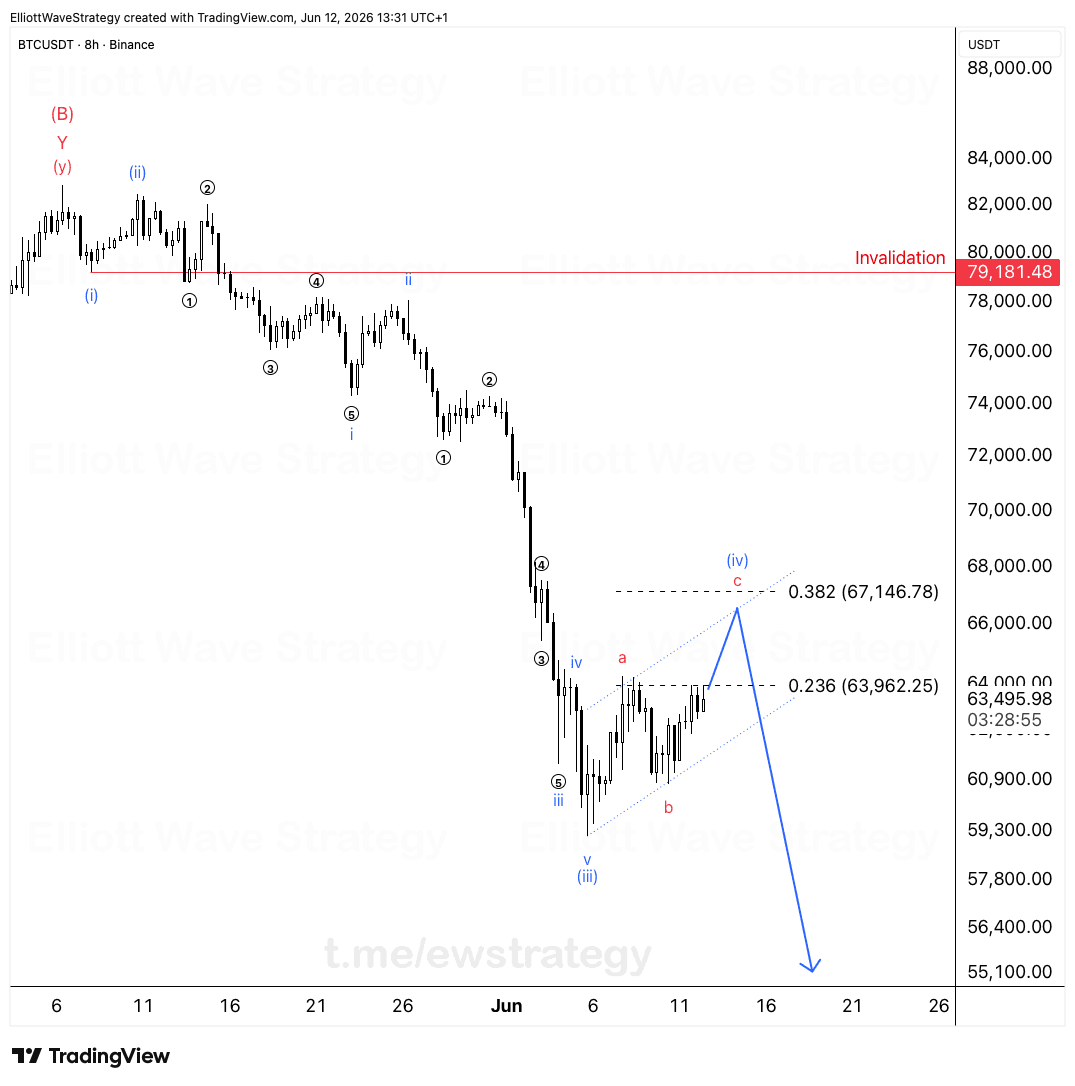
Amateur traders see three or four green candles and decide the trend flipped. They rush in without asking where price sits inside the larger structure. On the BTCUSDT 8h chart, the decline from the (B) wave high broke down into a clean five wave impulse, wave 1 through wave 5, followed by a second five wave impulse lower in blue: (i) through (v). What's happening now is the corrective bounce after that (iii) low, labeled (iv).
Why is the current BTCUSDT rally corrective, not a reversal?
Wave (iv) is doing exactly what wave (iv) is supposed to do. It retraces part of the prior decline without breaking the impulsive character of the move down. The internal structure of this bounce is unfolding as an a-b-c, visible on the chart as a small zigzag climbing inside a rising wedge shape.
That detail matters. A genuine trend change needs a five wave structure in the new direction. A three wave a-b-c move is corrective by definition. This is a bounce inside a bigger downtrend, not the start of a new uptrend.
What are the resistance zones for wave (iv)?
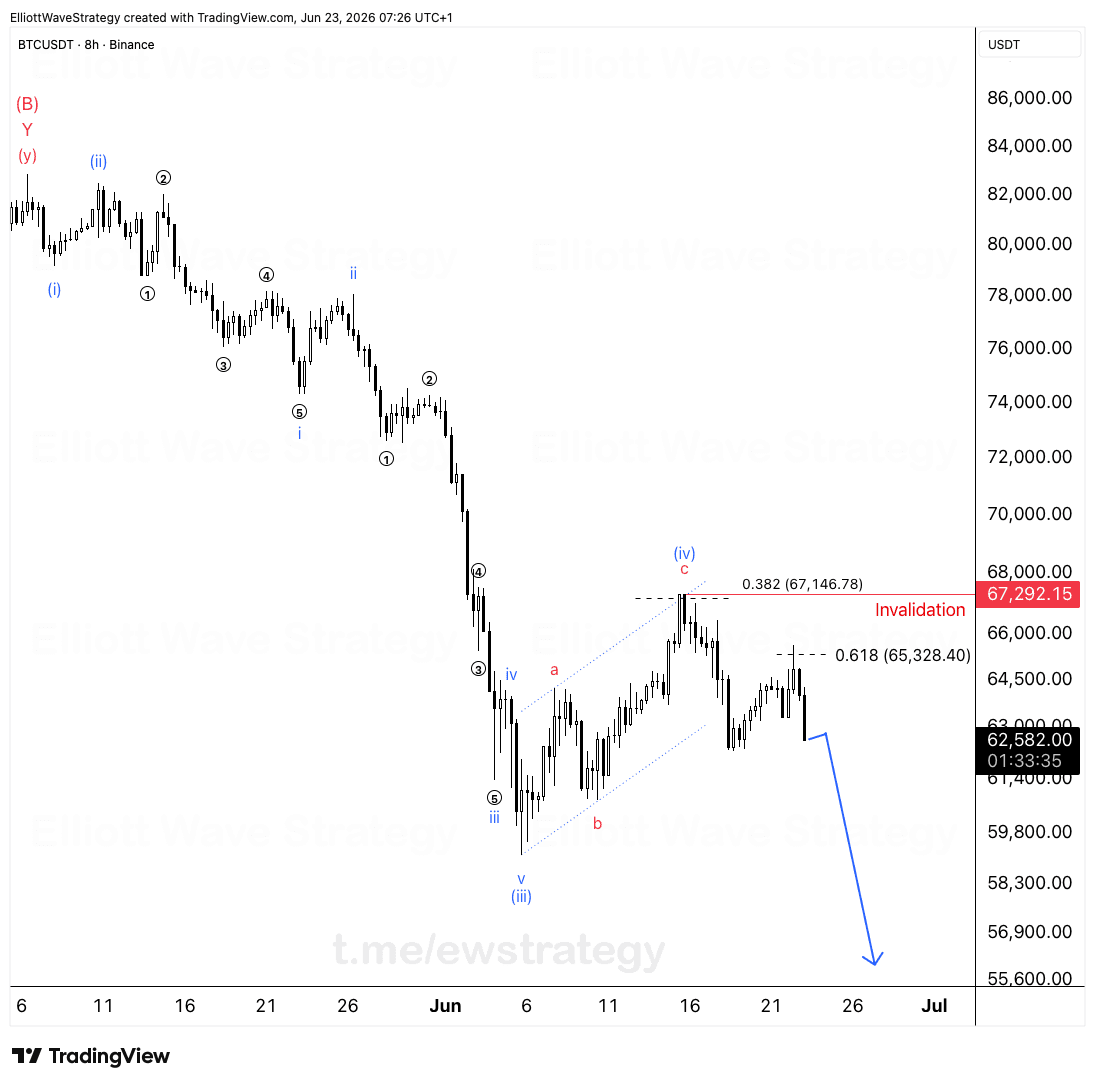
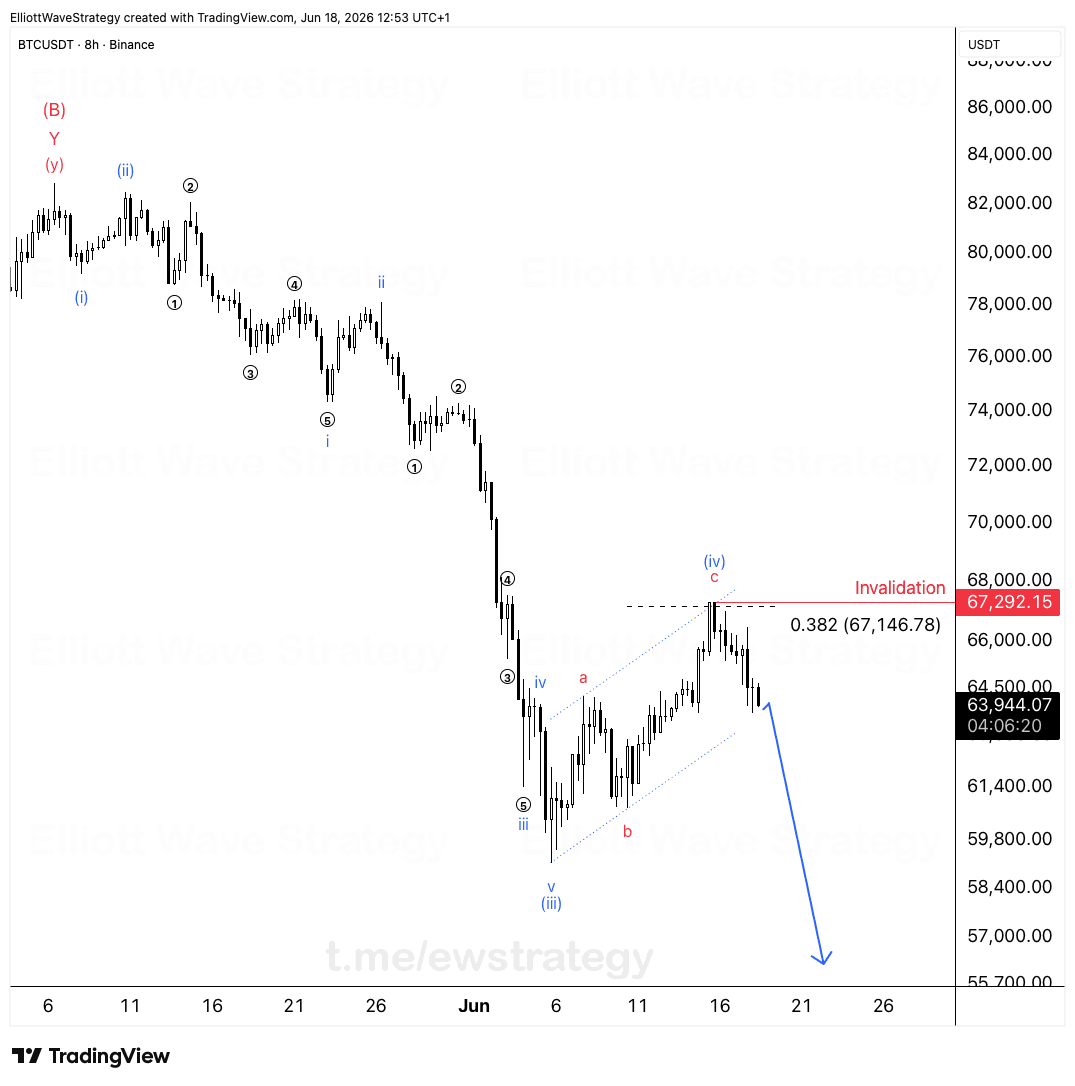
Two Fibonacci retracement levels box in this correction. The 0.236 retracement sits at 63,962 and the 0.382 retracement sits at 67,146. Price has already tagged the 63,962 zone with wave a of this bounce.
Wave c, if it extends further, has room to test 67,146 before the correction finishes. Both levels are natural resistance for a wave (iv) correction, not targets for a new bull run. The drawn projection on the chart shows wave c topping near 67,146 before turning down hard.
What happens after wave (iv) completes?
Once wave (iv) finishes, wave (v) takes over, and wave (v) points meaningfully lower than the current price zone. The chart's drawn trajectory shows the next leg down breaking well below the 60,900 area, continuing the impulsive decline that started at the (B) wave top.
The structure stays bearish until price invalidates it. The invalidation level is marked directly on the chart at 79,181.48. Below that line, the entire bearish count for wave (iv) and wave (v) remains valid.
What invalidates this bearish BTCUSDT count?
A close above 79,181.48 breaks the pattern. That level marks the top of wave (ii) territory, and reclaiming it would mean the decline from the (B) wave high is not behaving as a clean impulse anymore.
Until that happens, treat every bounce, including this one, as part of the corrective wave (iv) rather than a trend change. Traders chasing the bounce without checking the wave count are the ones wave (iv) is designed to catch.
The bigger picture on BTCUSDT has not changed. This remains a corrective cycle inside a larger downtrend, and the next major move is still lower once wave (iv) finishes its business near the 0.382 resistance.
Key Takeaways
- •BTCUSDT's bounce from 60k is labeled wave (iv), a correction inside a larger bearish structure, not a trend reversal.
- •The 0.236 retracement at 63,962 and 0.382 retracement at 67,146 are resistance zones for BTCUSDT's current corrective rally.
- •Wave (iv) on BTCUSDT is forming as an a-b-c zigzag, which confirms its corrective rather than impulsive nature.
- •Once wave (iv) completes, BTCUSDT's wave (v) is expected to push price meaningfully below the recent lows.
- •The bearish BTCUSDT count stays valid unless price closes above the invalidation level at 79,181.48.
Frequently Asked Questions
Is the BTCUSDT bounce from 60k a bottom?
According to this Elliott Wave count, no. The bounce is labeled wave (iv), a corrective retracement inside a larger decline, not a structural bottom.
What invalidates the bearish BTCUSDT Elliott Wave count?
A close above 79,181.48 invalidates the current bearish structure, since that level marks the top of the prior wave (ii).
What are the key resistance levels for BTCUSDT's wave (iv)?
The 0.236 Fibonacci retracement at 63,962 and the 0.382 retracement at 67,146 are the two resistance zones marked for this correction.
Disclaimer: This analysis is for educational purposes only and does not constitute financial advice. Elliott Wave analysis involves subjective interpretation. Always do your own research and manage your risk accordingly.
Get Full Coverage for All 27 Instruments
Premium members receive daily wave counts with entry zones, targets and invalidation levels, published daily across all 27 instruments.
View Premium Plans