XAGUSD Elliott Wave: Triangle Breaks, Wave 3 of (C) Targets 63.84
The breakdown accelerated exactly as the larger degree count suggested. Wave 3 of (C) targeting the 1.618 extension.
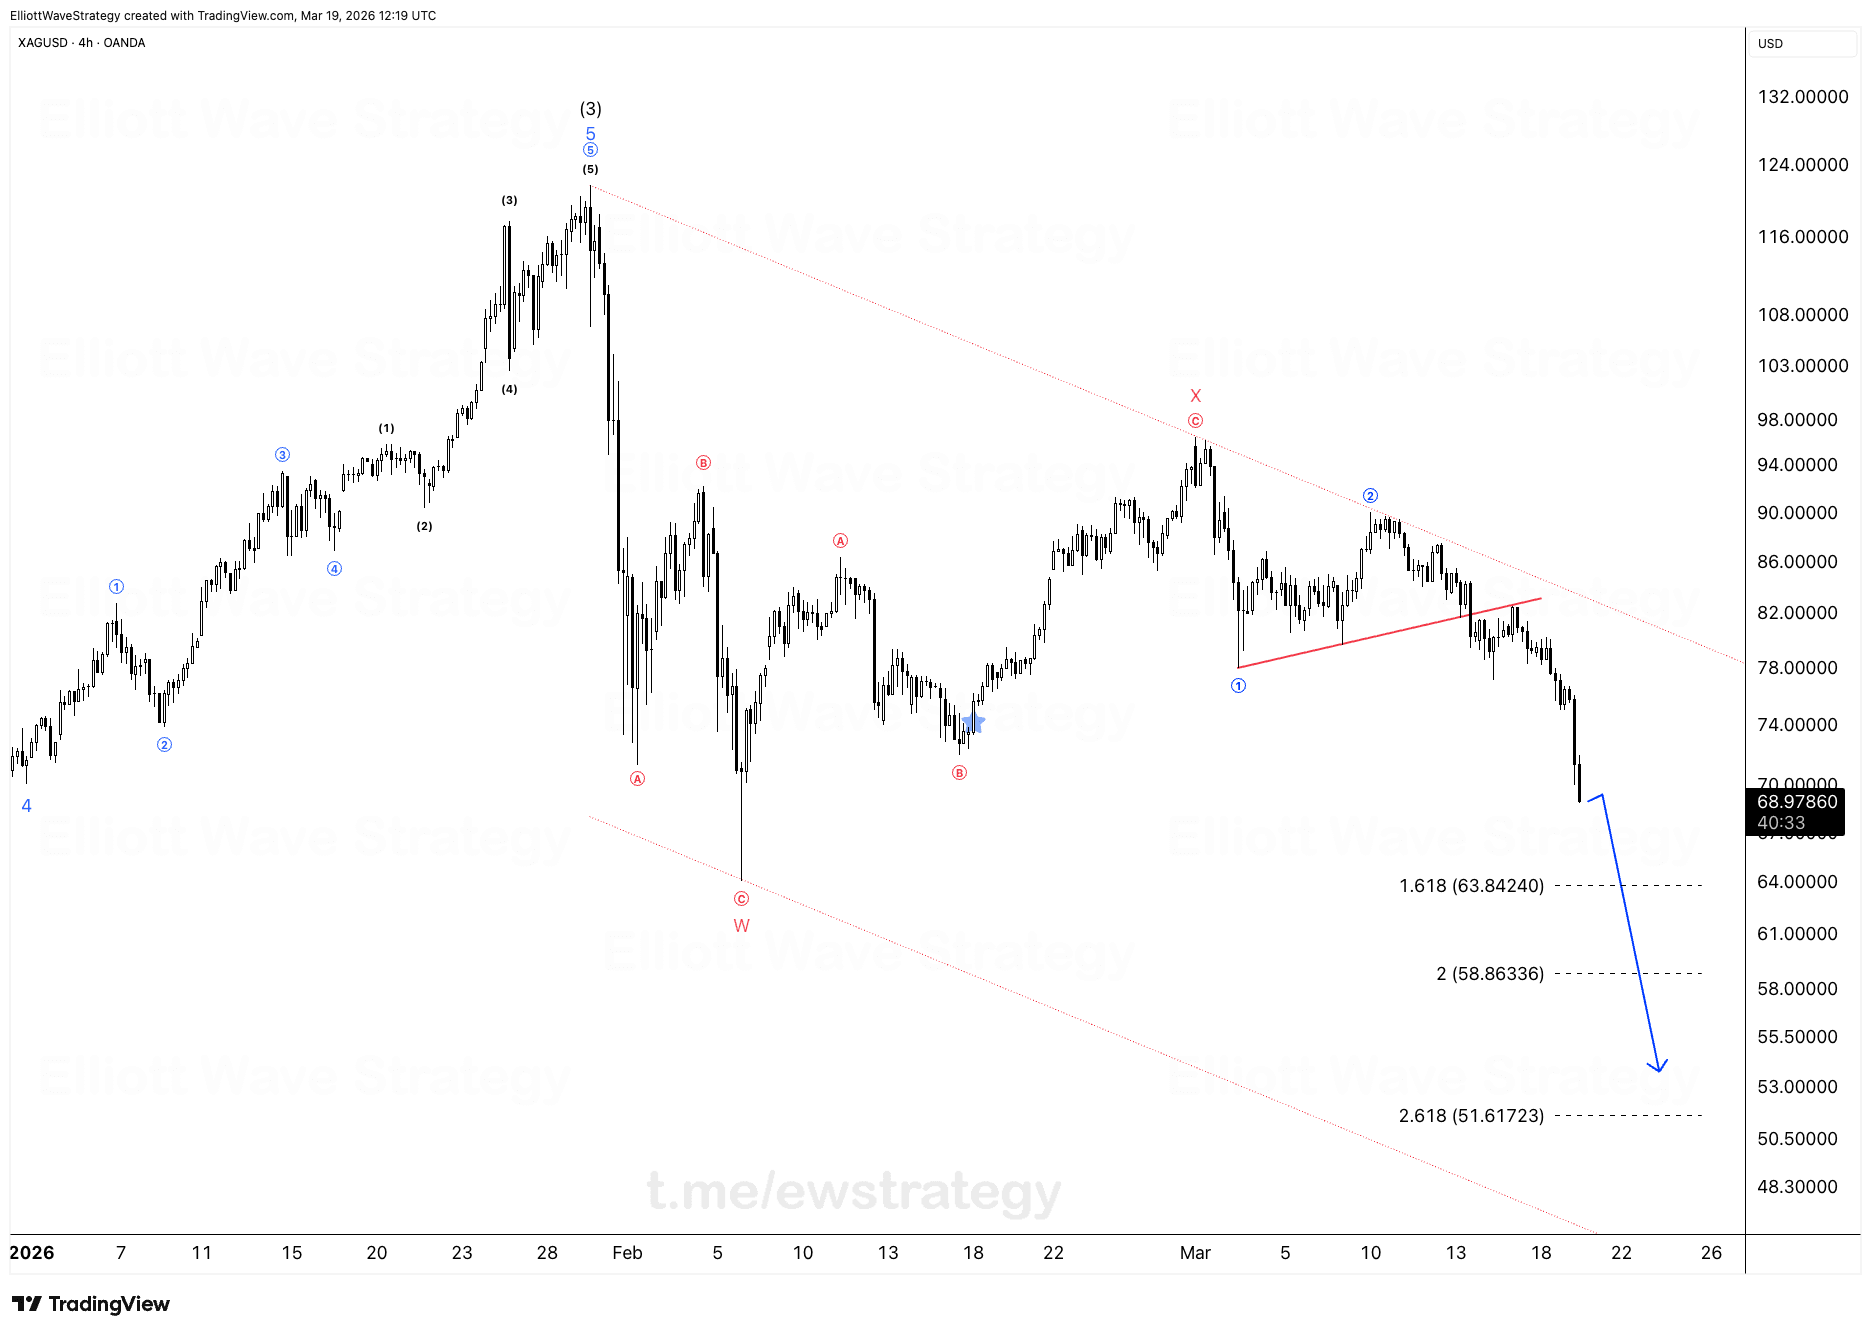
The breakdown accelerated today exactly as the larger degree count suggested. Silver did not need a new excuse to fall apart. It just did what the structure had been pointing to for weeks.
Wave 3 of (C) is now targeting the 1.618 extension at 63.84240, with the 2.618 extension at 51.61723 sitting further below as the next logical stop if momentum keeps this pace. While amateurs were buying every dip thinking XAGUSD was "oversold," the structure was screaming bigger correction ahead. No surprises here, just following the roadmap.
Why did the XAGUSD triangle break lower?
Look at the price action from March into the middle of this month. XAGUSD carved a clean contracting triangle labeled wave 2, sitting right under the descending trendline that has capped every rally since the wave (5) top near 124.
Triangles are supposed to resolve in the direction of the prior trend. Wave ① down into that triangle told you exactly which way this was headed. The break below the lower triangle boundary in the past few sessions confirmed the resolution: down, fast, and without hesitation.
This is precisely why triangle patterns get so much attention in Elliott Wave analysis. They are consolidation structures that store energy for the next impulsive leg. Traders who ignored the triangle and focused only on the bounce inside it missed the setup entirely.
What does wave 3 of (C) mean for silver right now?
The chart labels this decline as the C wave of a larger corrective sequence, with the (C) leg itself unfolding as an impulse. We are now inside its third wave, the segment that typically produces the sharpest, most emotional price movement of the entire pattern.
Third waves do not care about round numbers or comfort zones. They extend. The 1.618 extension at 63.84240 is the first real Fibonacci target for this leg down. If the impulse keeps extending the way third waves often do, the 2.618 extension at 51.61723 becomes the next relevant level.
Neither number is a prediction of exactly where price stops. They are the levels where this type of wave structure has statistical relevance, drawn directly from the extension of the prior waves in this decline.
Why do dip buyers keep getting caught in XAGUSD?
Every leg down in this chart has produced a bounce that looked, on the surface, like a bottom. The A-B-C bounces inside this larger correction gave dip buyers just enough hope to keep stepping in.
The problem is that "oversold" is not a wave count. It is a feeling. Structure does not reward feelings, it rewards the sequence of impulses and corrections that were already visible before the move happened.
The triangle before this breakdown was the last clear warning. A sideways, contracting pattern sitting below a well respected trendline, followed by a lower resolution, is not a random event. It is wave 2 finishing its job before wave 3 takes over.
Closing thoughts
This decline in XAGUSD is not finished just because it has already moved fast. Wave 3 of (C) targeting 63.84240, with 51.61723 as the extended target, is the framework worth watching from here. The structure called the breakdown before it happened, and it is still the only thing worth following now.
Key Takeaways
- •XAGUSD's contracting triangle resolved lower, confirming the bearish structure that was already visible in the wave count.
- •Wave 3 of (C) in XAGUSD is targeting the 1.618 extension at 63.84240.
- •A further extension in XAGUSD could reach the 2.618 level at 51.61723 if the impulsive decline continues.
- •Traders buying dips on "oversold" signals in XAGUSD were working against a structure that had already signaled a larger correction.
- •The triangle breakdown followed the roadmap that was tracked before price confirmed the move.
Frequently Asked Questions
What is the next target for XAGUSD after the triangle breakdown?
The 1.618 Fibonacci extension at 63.84240 is the first target for wave 3 of (C), with the 2.618 extension at 51.61723 as a further downside level if the impulse extends.
Why did the XAGUSD triangle pattern matter for the bearish outlook?
The triangle formed as wave 2 beneath a long standing descending trendline, and triangles typically resolve in the direction of the prior trend, which in this case was down.
Is wave 3 of (C) the same as a normal wave 3?
Yes, third waves in any degree tend to be the most impulsive and extended segment of a move, which is why the Fibonacci extensions become relevant targets during this phase.
Disclaimer: This analysis is for educational purposes only and does not constitute financial advice. Elliott Wave analysis involves subjective interpretation. Always do your own research and manage your risk accordingly.
Get Full Coverage for All 27 Instruments
Premium members receive daily wave counts with entry zones, targets and invalidation levels, published daily across all 27 instruments.
View Premium Plans