Silver XAGUSD: Triangle Compression Signals Coming Breakout
Silver has been quiet since February. Too quiet.
Silver has been quiet since February. Too quiet.
Wide range, slow moves, choppy candles. That's not nothing happening. That's a market building a contracting triangle. Each swing is shorter than the last. Price is squeezing into a smaller and smaller area, and that squeeze is the whole story right now on XAGUSD.
A triangle behaves like a spring. The longer it gets pressed down, the harder it jumps when it releases. Silver has been pressing down since late February. When it finally breaks, it won't creep out slowly. It will move fast and loud.
Why is XAGUSD moving sideways for so long?
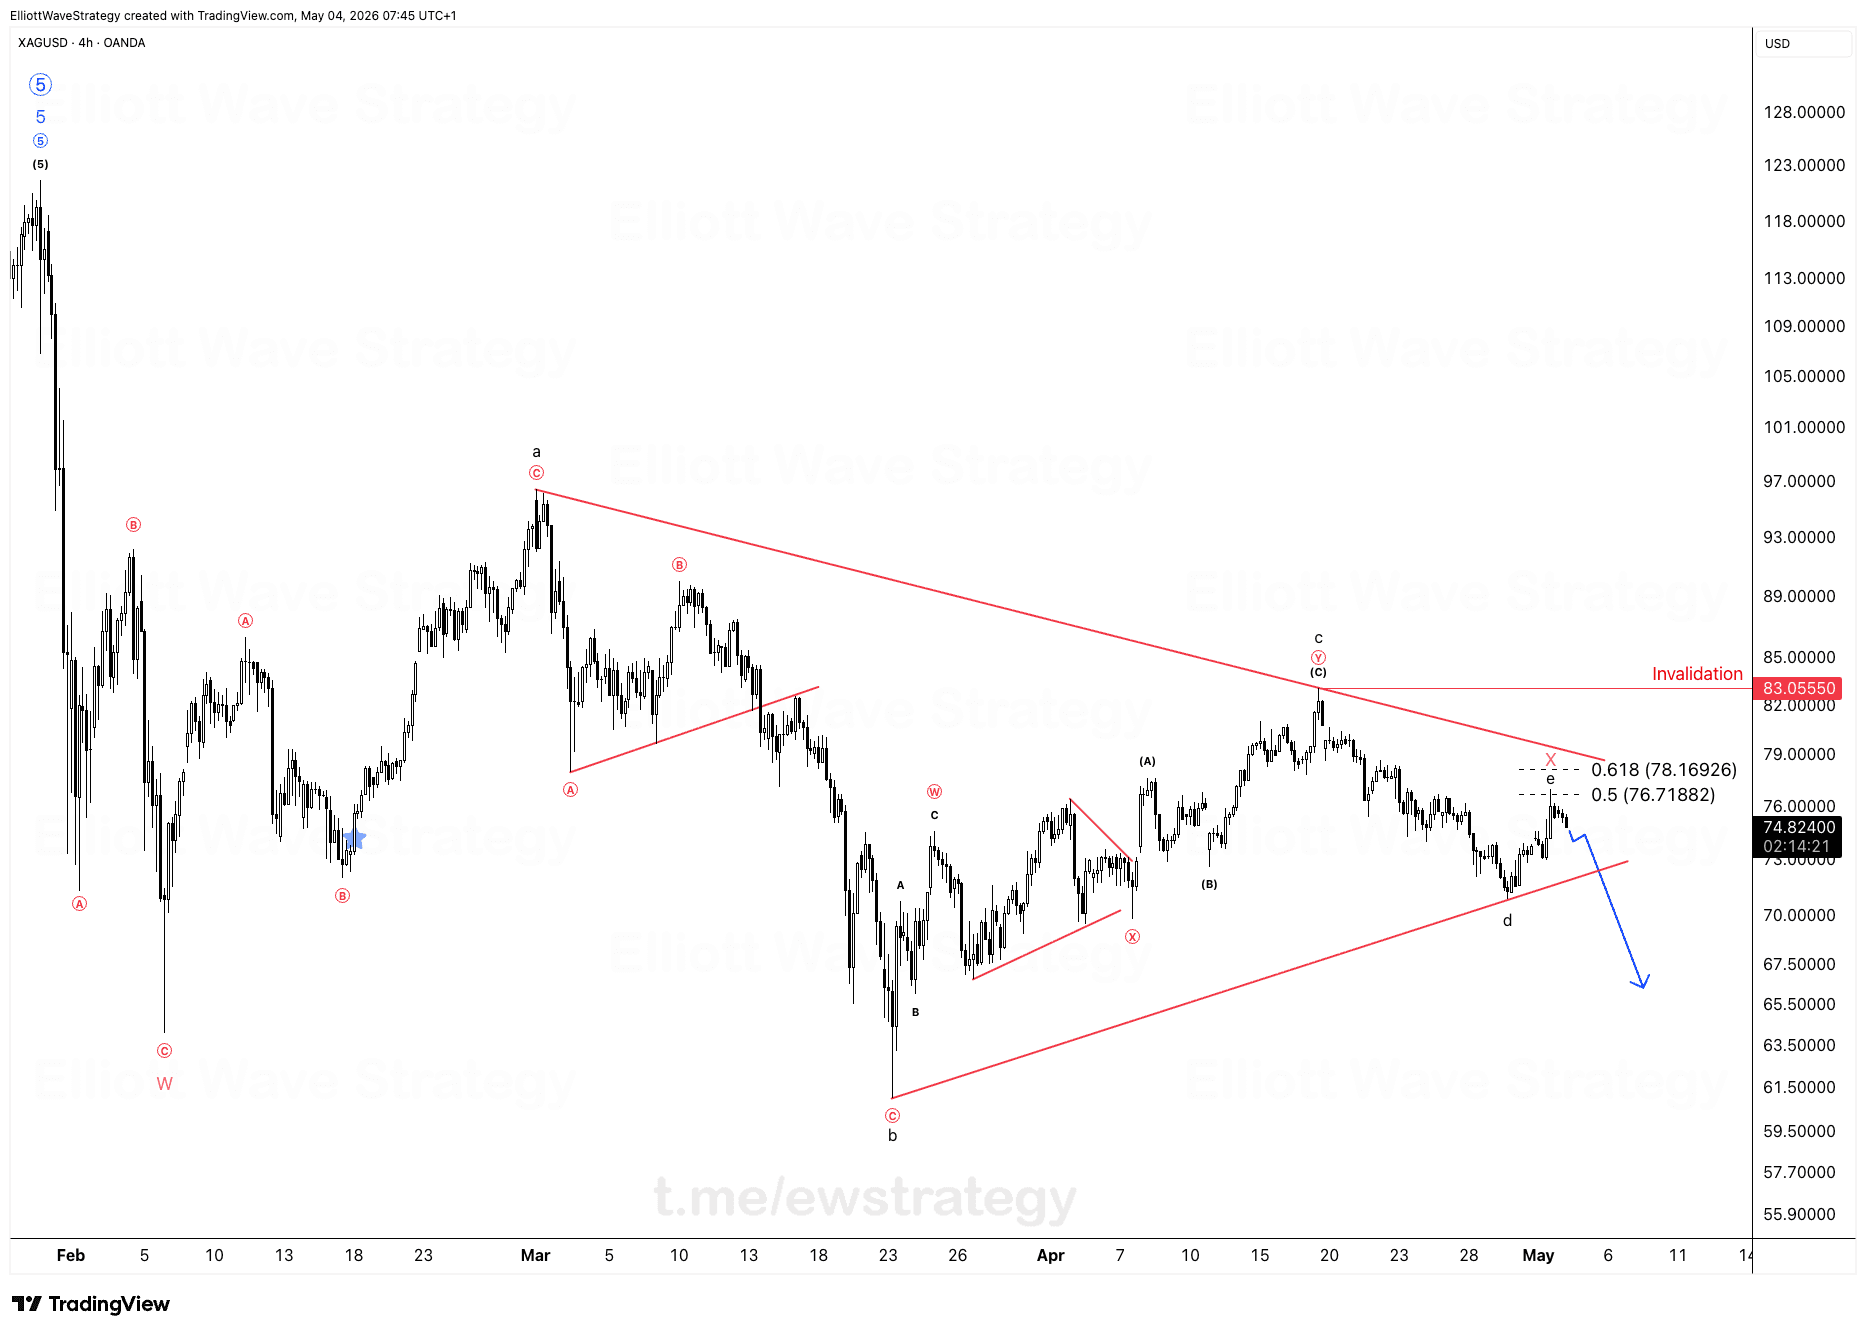
The chart shows silver working through a Wave (4) correction, and Wave (4) is unfolding as a contracting triangle labeled A, B, C, D, E. Look at the sequence: wave A dropped hard, B recovered, C pushed lower again, and each leg since has been getting smaller. That's the definition of contraction. It's not random chop, it's a specific corrective structure that Elliott Wave traders recognize immediately.
Most traders hate sideways action like this. They get impatient. They force trades into the noise, get chopped up, and lose money. Then they walk away right before the real move happens. That's the pattern that repeats in every triangle, on every instrument, every time.
What does the triangle mean for silver's next move?
Professional traders love triangles for one reason: the outcome is more predictable than in most other corrective patterns. A triangle almost always resolves with a sharp thrust in the direction of the prior trend. No more guessing about which way price goes once wave E completes and price breaks the triangle boundary.
On this chart, the invalidation level sits at 83.05550. As long as price respects that ceiling, the triangle count for Wave (4) holds. The drawn projection points toward a move down through the 76.71 and 78.16 Fibonacci levels once the triangle resolves, consistent with a Wave (5) decline completing the larger corrective structure from the (5) top.
How should traders approach a compressing triangle?
The answer isn't to trade every swing inside the triangle. That's exactly the trap that burns most retail accounts. The wide range and slow candles are designed to shake out patience.
We're not trading the chop on XAGUSD right now. We're waiting for the breakout. That's when the structure gives a clear direction and a setup worth acting on, instead of a coin flip inside a shrinking range.
Silver's triangle on the 4H chart is compressing exactly the way Wave (4) triangles are supposed to. Simple pattern, well defined boundaries, one invalidation level to watch. Plan the trade, and trade the plan when the breakout actually happens.
Key Takeaways
- •XAGUSD has been forming a contracting triangle since late February, consistent with a Wave (4) correction.
- •Each leg of the XAGUSD triangle is getting smaller, a classic sign of energy building before a sharp breakout.
- •The invalidation level for the current XAGUSD Elliott Wave count sits at 83.05550.
- •A triangle resolution typically produces a fast, directional move rather than another slow grind.
- •Fibonacci levels near 76.71 and 78.16 are in focus for the projected Wave (5) move once the triangle completes.
Frequently Asked Questions
What invalidates the bearish XAGUSD triangle count?
A sustained break above 83.05550 would invalidate the current Wave (4) triangle structure and the projected downside continuation.
Why do Elliott Wave traders pay attention to triangles?
Triangles are corrective patterns that almost always resolve with a sharp thrust in the direction of the prior trend, which makes the breakout more predictable than random chop.
What comes after a Wave (4) triangle completes?
Once a Wave (4) triangle finishes its final leg, price typically thrusts sharply to complete Wave (5) in the direction of the larger trend.
Disclaimer: This analysis is for educational purposes only and does not constitute financial advice. Elliott Wave analysis involves subjective interpretation. Always do your own research and manage your risk accordingly.
Get Full Coverage for All 27 Instruments
Premium members receive daily wave counts with entry zones, targets and invalidation levels, published daily across all 27 instruments.
View Premium Plans