Real chart snapshots with Elliott Wave markup. We publish free analysis regularly so you can see our methodology in action.
Each free chart is a dated snapshot of a full Elliott Wave count: wave labels, Fibonacci levels and the invalidation line, exactly as our members receive them.
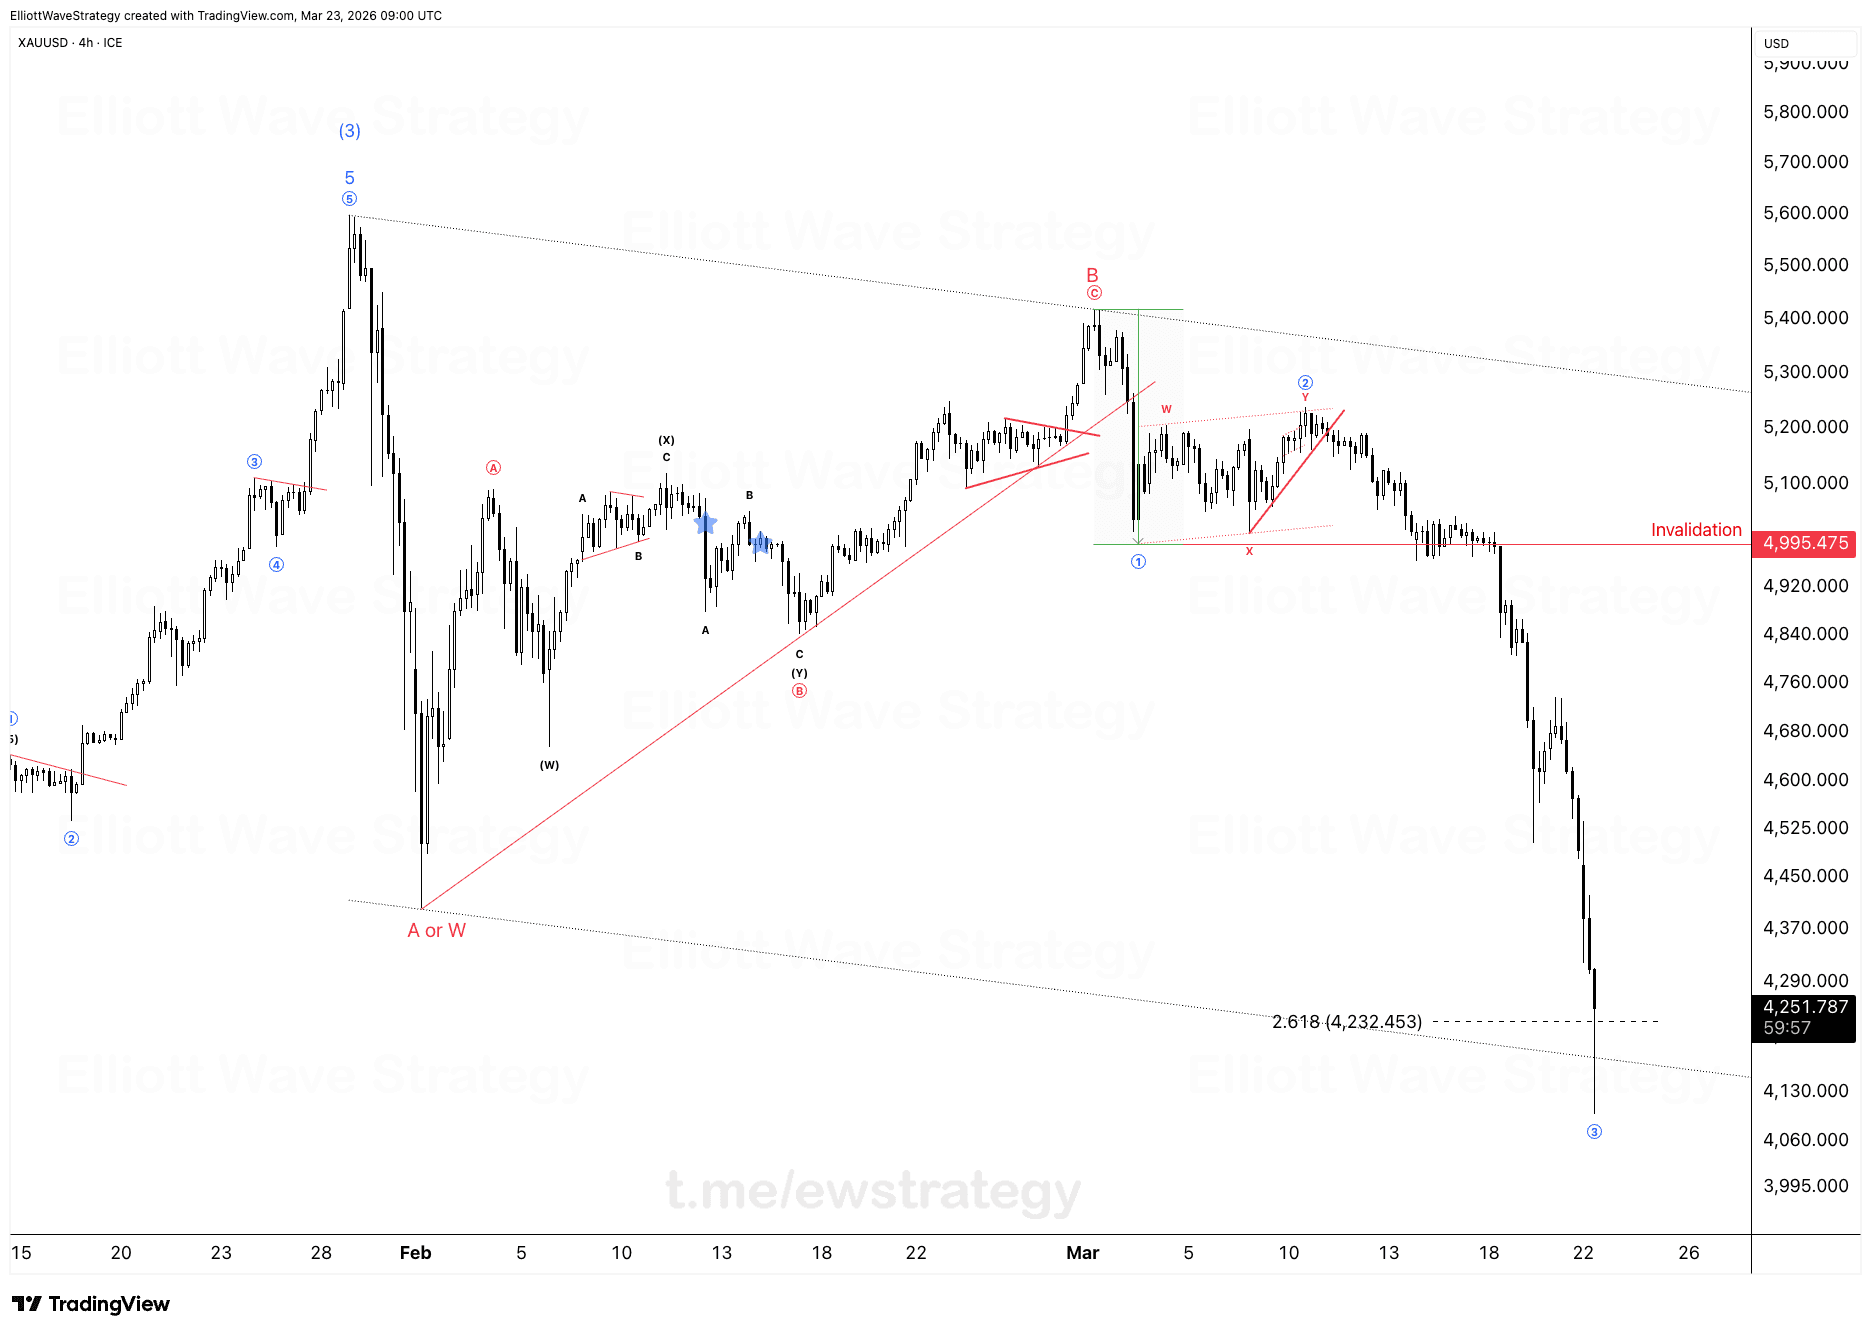
One month ago, we shared this exact scenario with Premium members. The complex correction, the invalidation level, the target zone — everything playing out as planned.
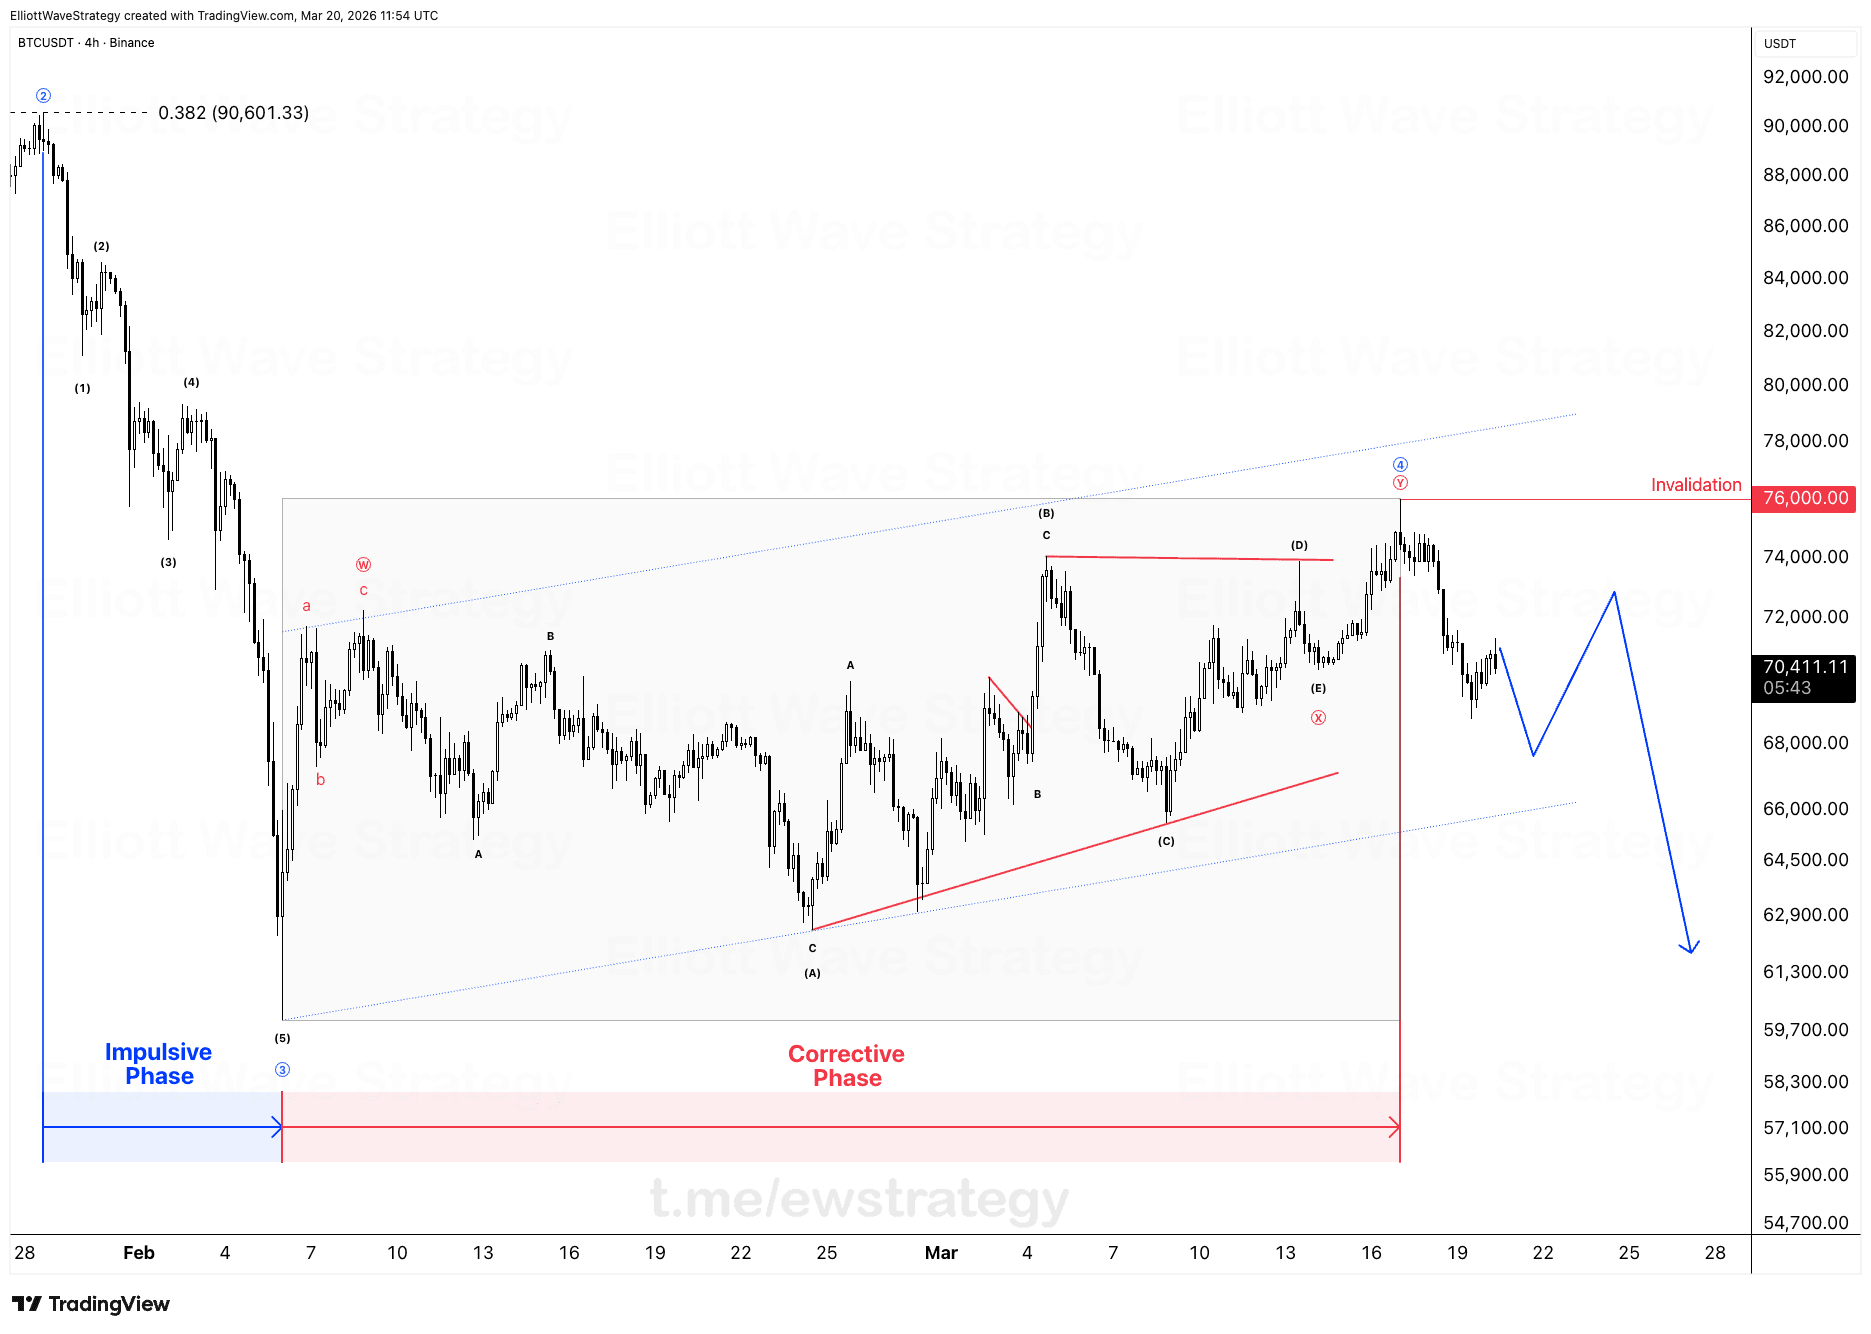
Impulsive phase down is sharp and clear. Corrective phase is slow, choppy, overlapping. A new macro trend never begins with a corrective pha...
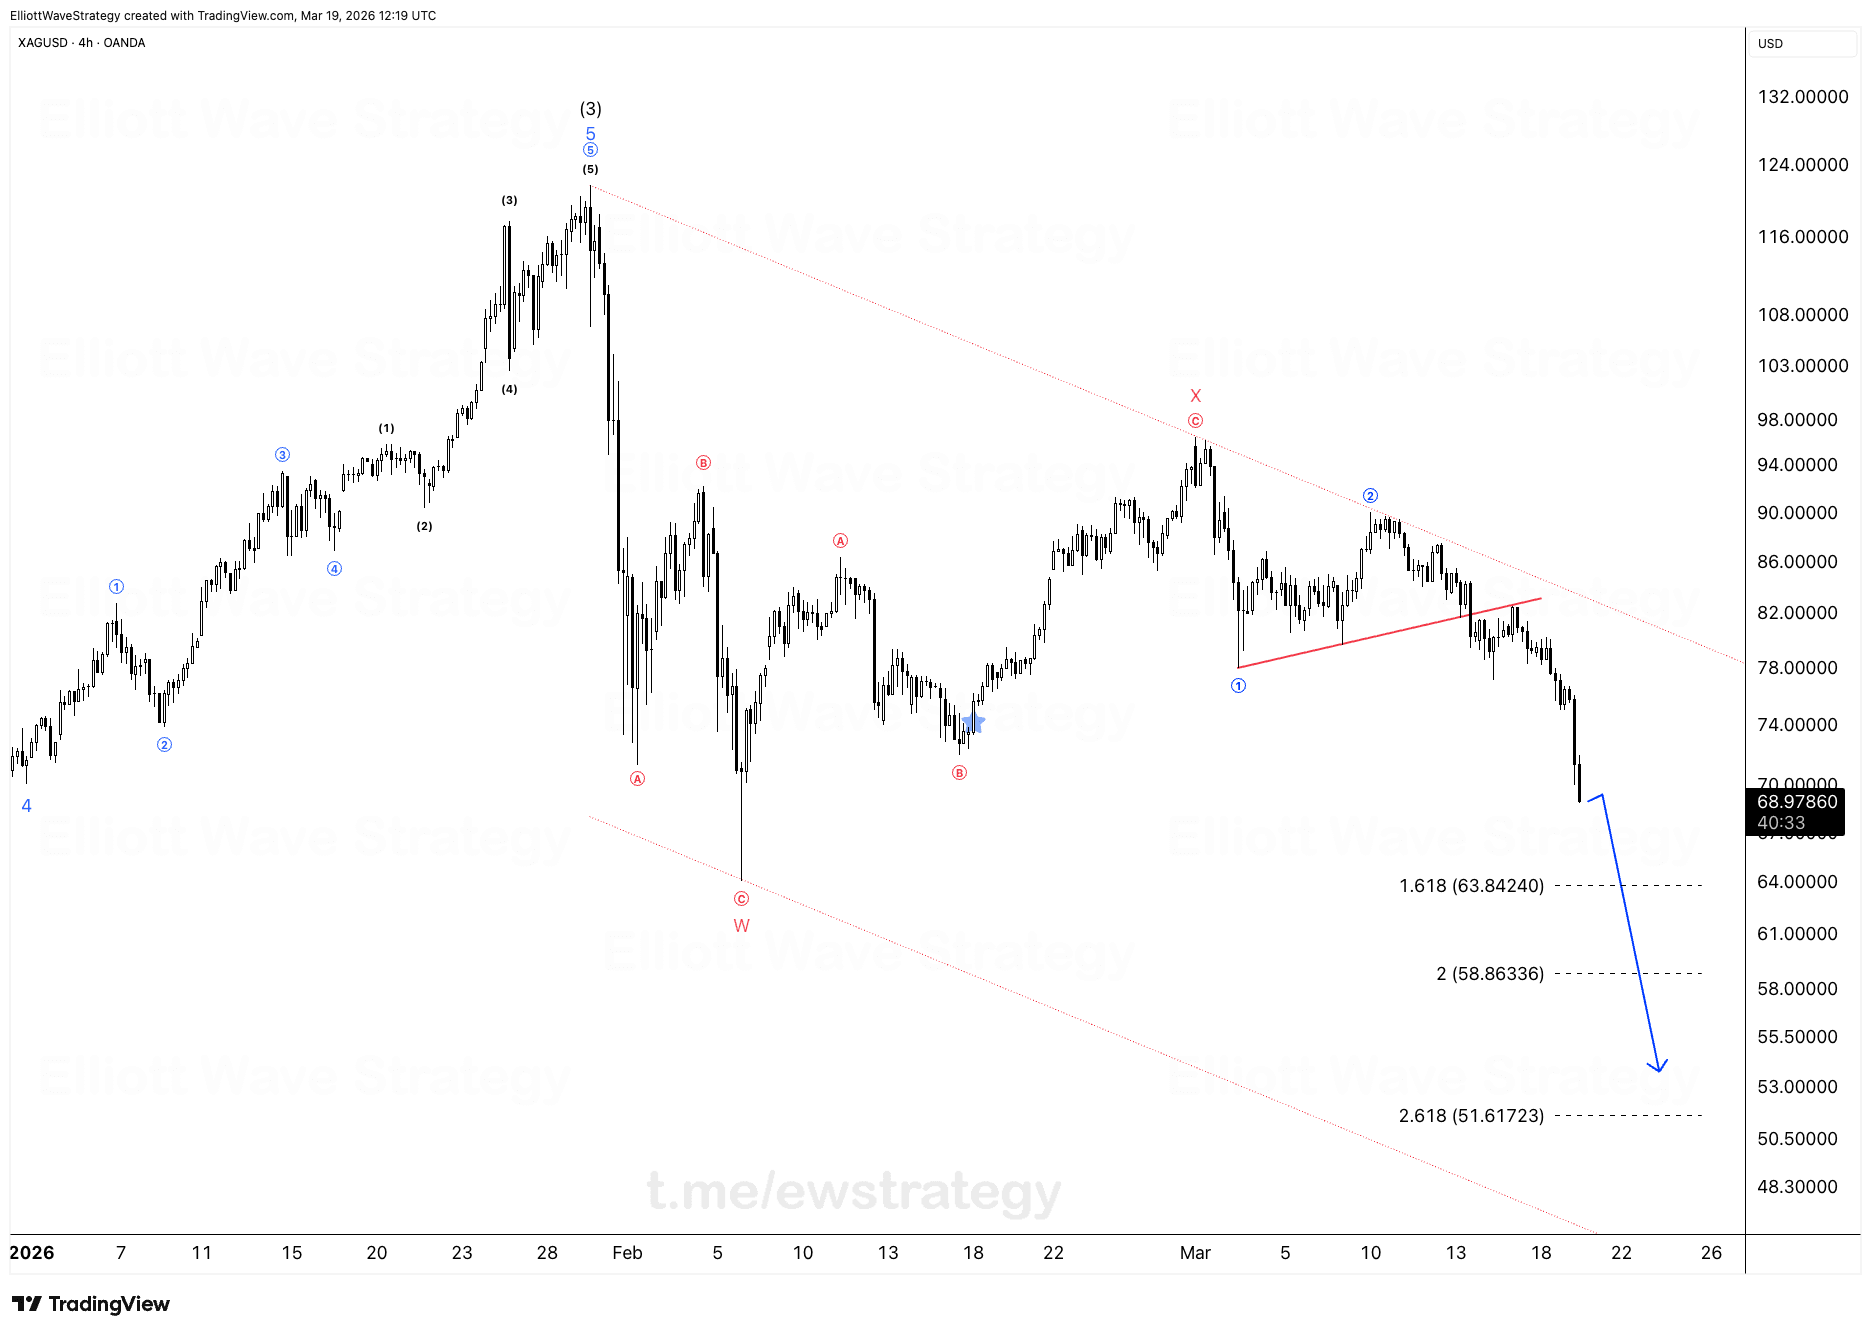
The breakdown accelerated exactly as the larger degree count suggested. Wave 3 of (C) targeting the 1.618 extension.
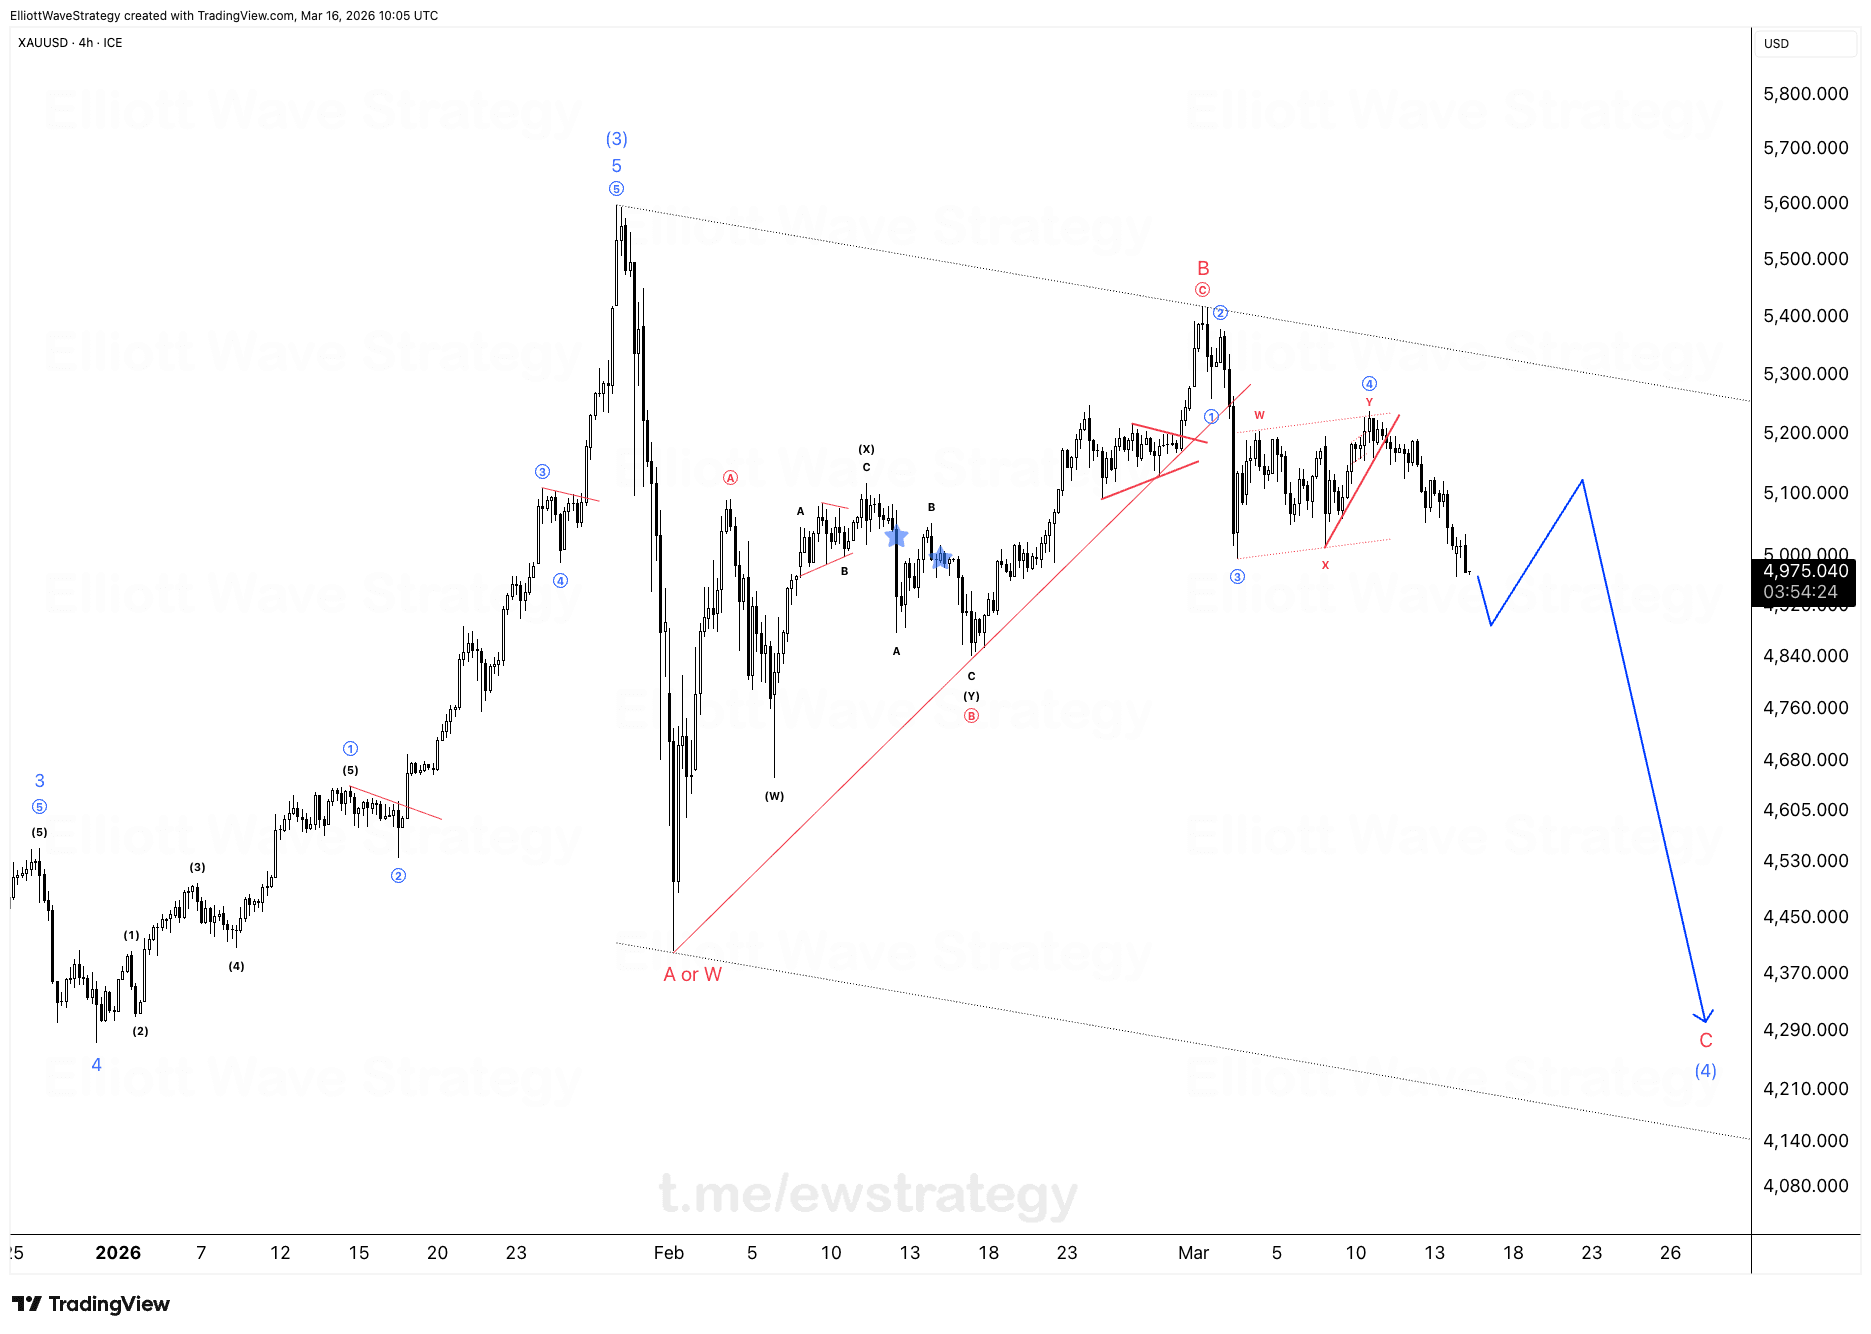
While amateur traders were predicting tops and bottoms based on feelings, we patiently tracked the structure. The complex Wave (4) consolida...
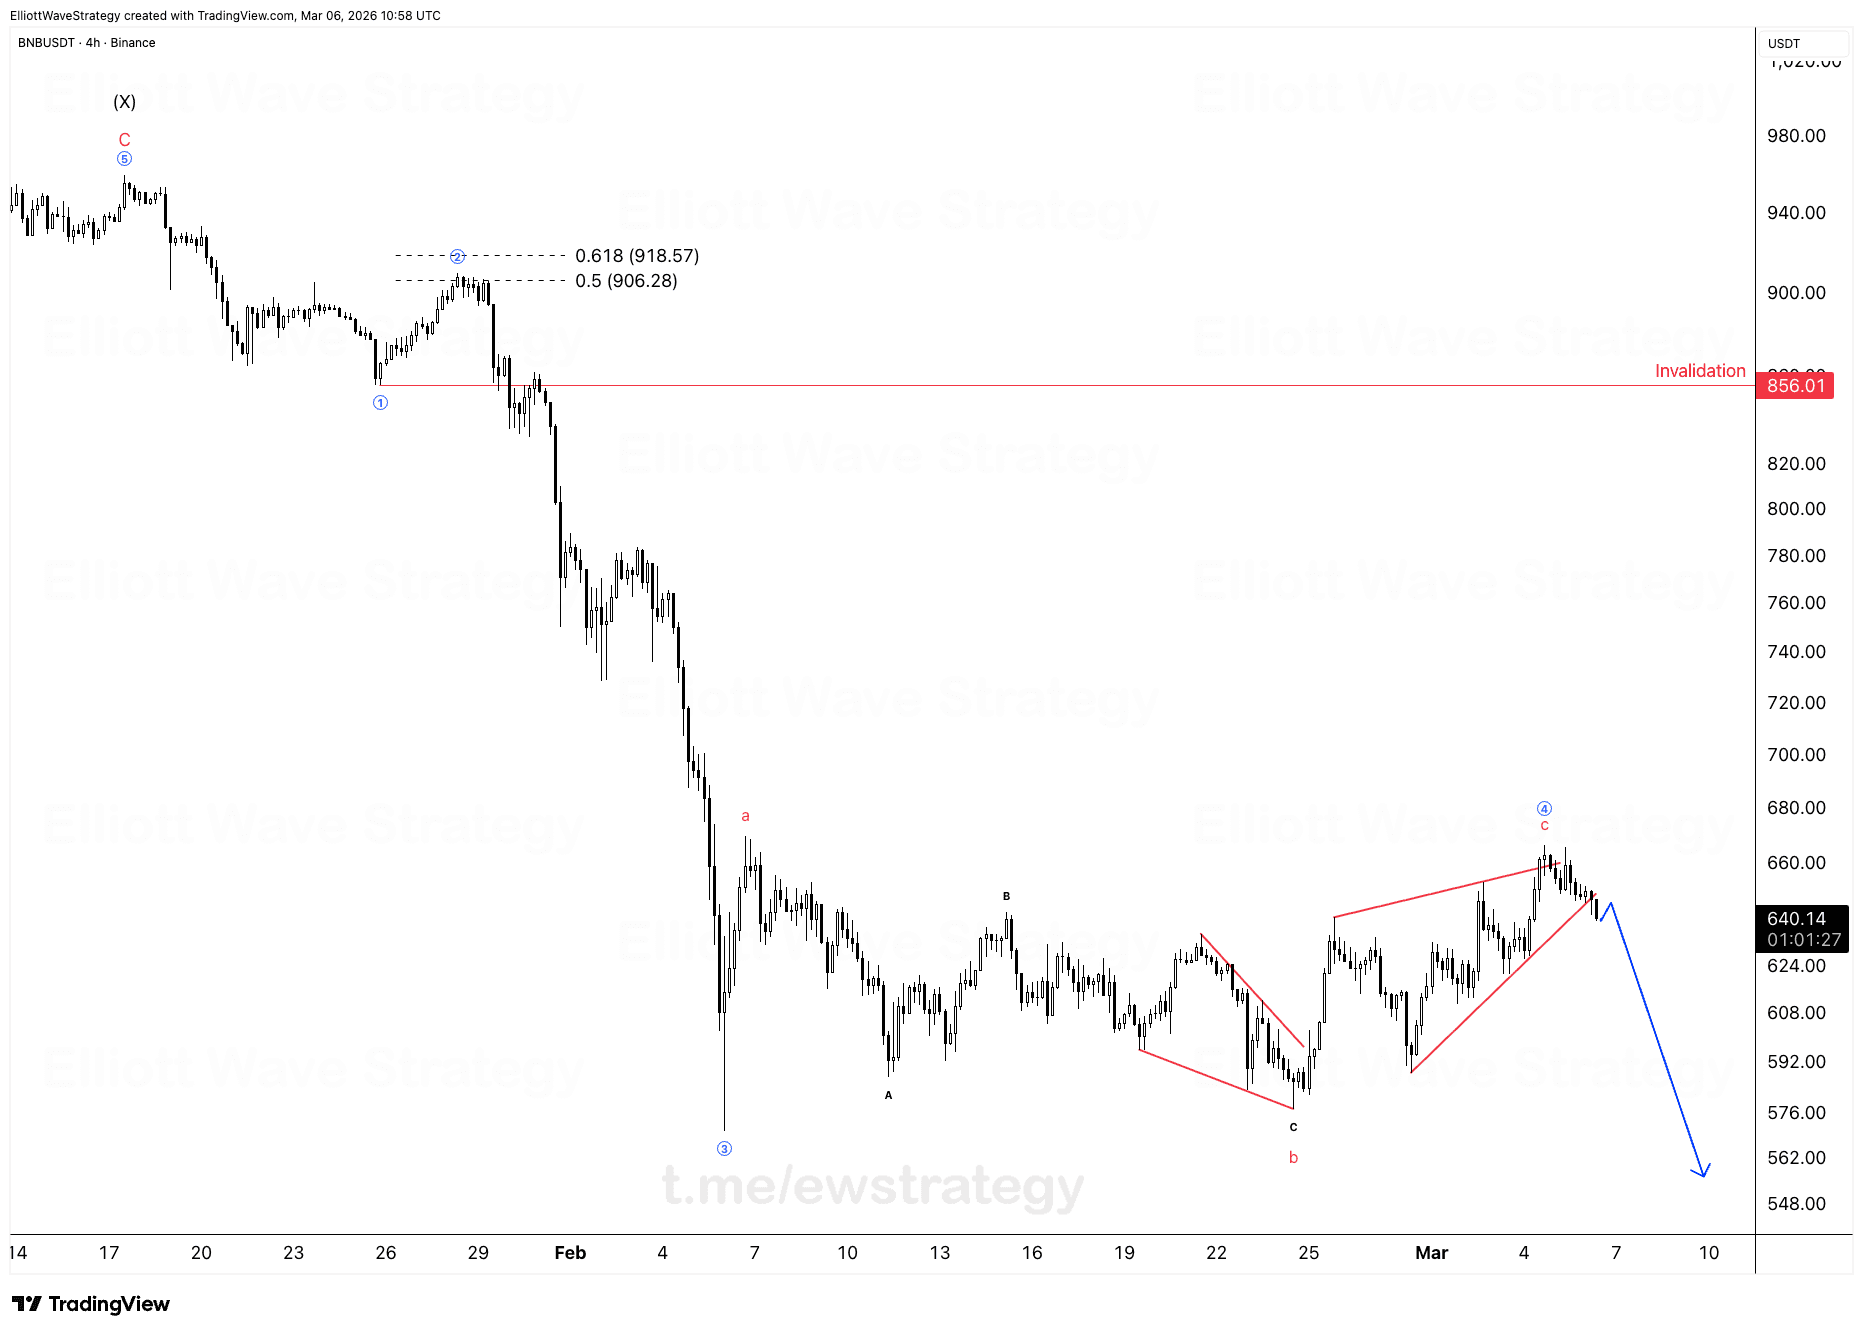
The hardest part of trading is having the discipline to wait for the pattern to fully complete. Never force a trade while the market is deci...
Premium members get daily wave counts, entry zones, targets and invalidation levels for all 27 instruments.
See Premium PlansDated snapshots of real Elliott Wave counts published by EW Strategy: wave labels, Fibonacci levels and the invalidation line on the actual chart, exactly as members receive them.
Regularly, across forex, gold, crypto and indices. Members receive daily updated counts for 27 instruments; the free charts are a rotating sample of that coverage.
The invalidation line is the price level where the published wave count stops being valid. If price crosses it, the count is invalidated and the analysis is updated with a new structure.
