BTCUSDT: Why This Choppy Consolidation Ends in a Drop
Impulsive phase down is sharp and clear. Corrective phase is slow, choppy, overlapping. A new macro trend never begins with a corrective phase.
Everyone looking for the next big move up in BTCUSDT is missing the obvious.
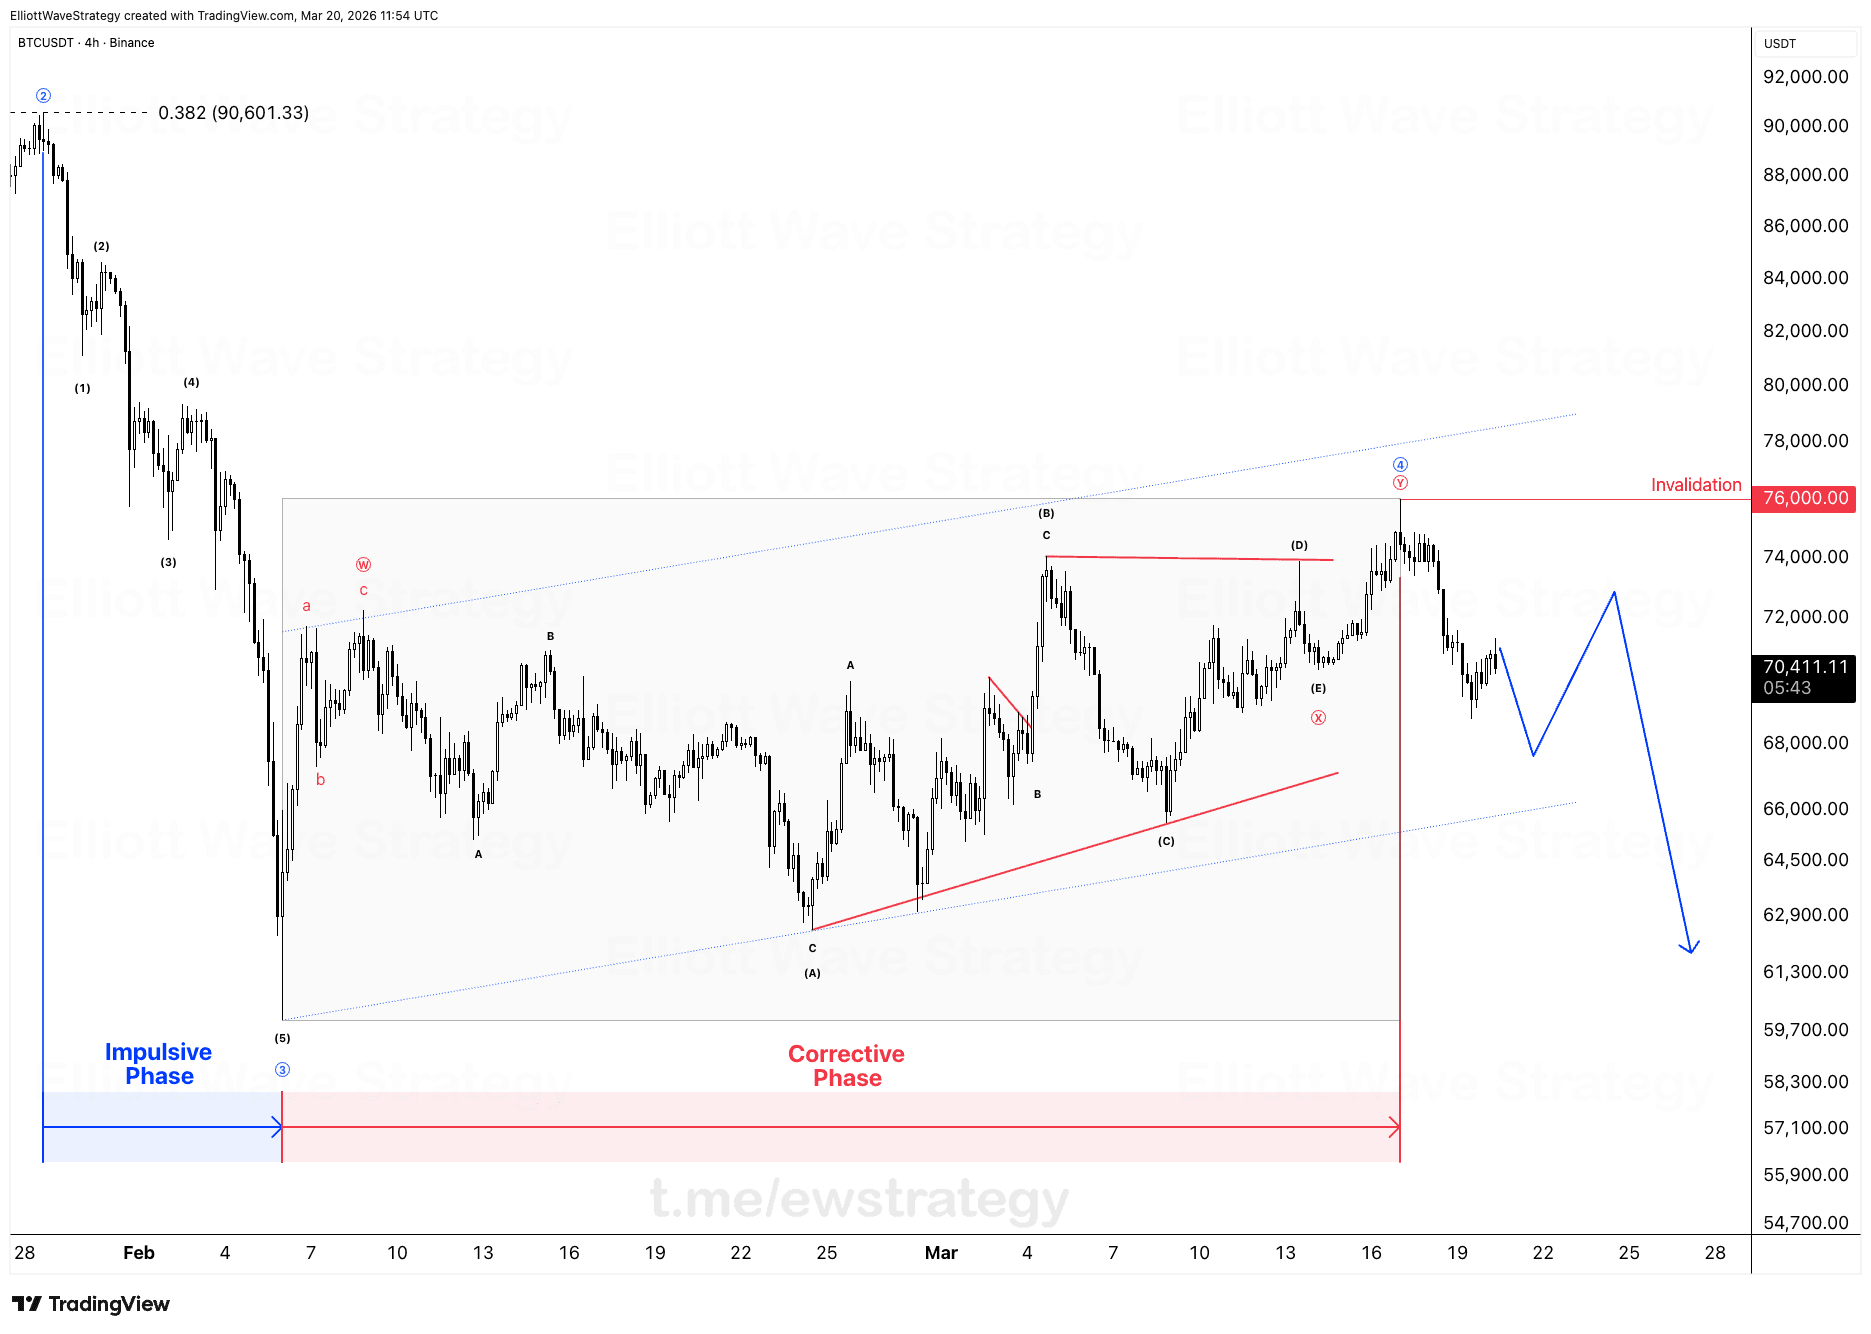
Study the chart. The impulsive phase down, waves (1) through (5) into the ② high near 90,601, is sharp and clear. Every leg overlaps cleanly, every swing has that clean five-wave signature. Then price starts building this month-long mess of overlapping candles, and traders start dreaming about a reversal.
Why does the corrective phase look so messy compared to the decline?
Because it is a correction, not a new trend. That is the entire point.
On the chart this shows up as a WXY structure. Wave W unfolds as a zigzag with its own a-b-c, wave X pulls back, and wave Y builds out as a triangle: (A), (B), (C), (D), (E). Triangles chop sideways precisely because they represent indecision and exhaustion, not conviction. The overlapping, grinding price action inside that shaded box is not random. It is what a corrective wave is supposed to look like.
Compare that to the impulsive leg down on the left side of the chart. Clean, directional, minimal overlap. That contrast alone tells you which phase is the trend and which phase is the pause.
What is the rule everyone skips when they call a reversal?
A new macro trend never begins with a corrective phase. Full stop, that is how Elliott Wave works.
Impulsive moves start trends. Corrective moves interrupt them. This triangle sitting under the ④ label at the Y wave completion is not the birth of a new bull run, it is the bears catching their breath before the next leg down. When a correction finishes, the market does not wander off in a new direction, it resumes the prior trend, and it usually does it with force.
That is why the drawn trajectory on the chart shows price rolling over from around 76,000, dipping toward 68,000, bouncing to test near 73,000, and then breaking down toward the 61,300 area. That is not a guess, that is the structural expectation once a WXY correction like this one completes.
What invalidates this bearish view?
The invalidation is marked directly on the chart at 76,000. A sustained move above that level would break the corrective count and force a rethink of the entire structure. Until that line gets taken out, the correction remains a correction, nothing more.
The waves are screaming the same message they always scream when a correction like this drags on: the previous trend resumes, and it resumes with violence.
BTCUSDT traders chasing a breakout to the upside off this triangle are fighting the structure, not reading it.
Key Takeaways
- •BTCUSDT's decline from the ② high near 90,601 unfolded as a clean, sharp impulsive sequence with minimal overlap.
- •The month-long consolidation in BTCUSDT is a WXY corrective structure, ending in a contracting triangle labeled (A) through (E).
- •A new macro trend never starts with a corrective phase, which means this BTCUSDT triangle points to trend resumption, not reversal.
- •The invalidation level for the bearish BTCUSDT count sits at 76,000, printed directly on the chart.
- •The drawn trajectory projects BTCUSDT toward the 61,300 region after a corrective bounce completes near 73,000.
Frequently Asked Questions
What invalidates the bearish BTCUSDT Elliott Wave count?
A sustained break above 76,000, the level marked as invalidation on the chart, would undermine the corrective count and require a fresh read of the structure.
Why does BTCUSDT's sideways price action matter for the trend?
The choppy, overlapping price action fits the profile of a corrective wave, specifically a WXY structure ending in a triangle, which typically precedes resumption of the prior trend rather than a reversal.
Does a triangle pattern in BTCUSDT signal a bullish reversal?
No. Triangles are corrective patterns that reflect exhaustion and indecision, and they almost always resolve with the prior trend resuming, not with a brand new trend starting.
Disclaimer: This analysis is for educational purposes only and does not constitute financial advice. Elliott Wave analysis involves subjective interpretation. Always do your own research and manage your risk accordingly.
Get Full Coverage for All 27 Instruments
Premium members receive daily wave counts with entry zones, targets and invalidation levels, published daily across all 27 instruments.
View Premium Plans